Imagine this
A robot can plan a path, check where it is, and change direction when it is off course. If it turns too much or reacts too late, it may go the wrong way. A model does not prove a real robot is safe.
THE FIELD GUIDE / 026 · ROBOTICS AND CONTROL
A robot drifts sideways after a wheel slips. How does it notice, decide what to change and check whether its correction helped?
A robot can plan a path, check where it is, and change direction when it is off course. If it turns too much or reacts too late, it may go the wrong way. A model does not prove a real robot is safe.
Feedback models explain route correction and delay. Real walls matter, but this demonstration does not simulate them. A tested navigation system could help in a defined setting.
The route calculation does not prove a real robot has enough room to avoid a wall. Real sensors, moving things, slopes and speed can change what happens.
Read-aloud starter; not yet tested with children. The fuller science, data, figures and sources follow below.
Imagine an inspection robot moving along a corridor. Repeating the same motor command will not reveal that it has drifted. A camera can compare visible landmarks with a reference, estimate the displacement and request a correction. The next observation checks whether the correction helped.
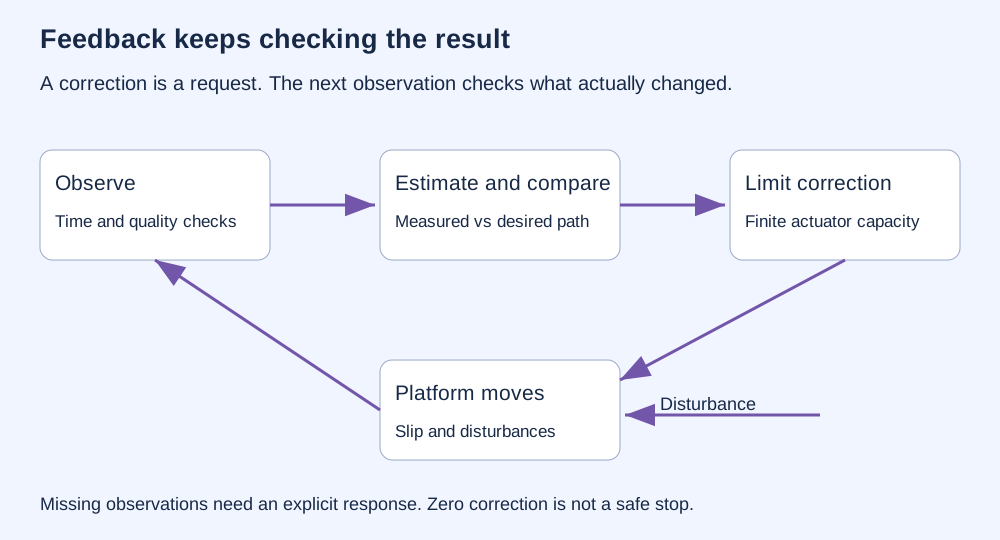
Each stage can fail differently. A dark image may hide landmarks. Repeated patterns can produce the wrong match. A good estimate can arrive late. A sensible correction may exceed what the wheels or steering can deliver. Real visual navigation combines calibration, tracking, mapping and failure handling; ORB-SLAM is one documented example. The small models on this page do not implement it.
SYNTHETIC SIDEWAYS ERROR · UPDATE STEPS, NOT SECONDS
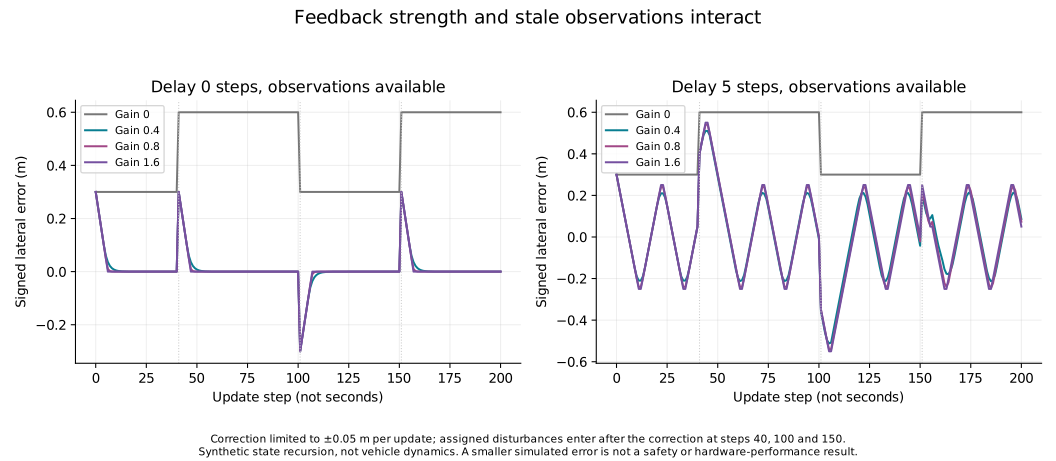
Our invented robot starts 0.30 m to one side of its intended line. At each update it requests a correction proportional to the measured error. The correction is limited to 0.05 m per update. Three assigned sideways disturbances interrupt its progress.
Solid purple: selected correction. Dashed grey: no correction. The vertical scale adjusts to fit the errors; it is labelled in metres.
Start at zero gain, then try 0.8. Add a five-step delay: the controller acts on old information and can keep correcting after the error has changed sign. This can produce oscillation. A stronger gain does not remove the delay.
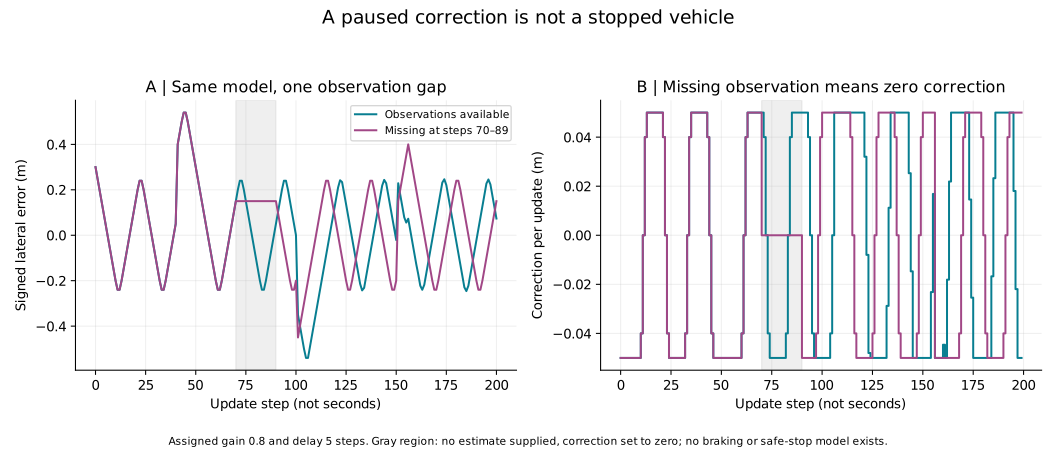
When observations disappear, this demonstration applies zero correction. It does not simulate braking, safe stopping or obstacle avoidance. The sideways state may continue to change. A real system needs a defined, tested response to missing information.
There is no speed, mass, motor, wheel slip physics or time interval in this recurrence. An update is an abstract calculation step. Disturbances are assigned jumps, and the error estimate is otherwise exact. This model illustrates feedback, not a vehicle's performance.
A separate, older calculation compares lateral correction with no correction in an artificial corridor. It generates 64-bit feature descriptions and matches them using Hamming distance: the number of differing bits. At least six accepted correspondences are required for a lateral estimate.
The simulator supplies forward position in 0.1 m increments. It does not visually estimate forward travel, form real camera images or model physical motion over time. A nominal 200-step sequence has its final observation at 19.9 m. Random feature deletion imitates missing inputs, not the geometry of a real object blocking a camera.
| Recorded condition | Correction enabled | No correction |
|---|---|---|
| Endpoint within 0.25 m lateral band | 100 / 100 trials | 28 / 100 trials |
| Event window with at least one threshold hit | 300 / 300 windows | 160 / 300 windows |
The correction-enabled counts were recalculated from the 100 stored trial summaries. Its event flags were counted, but cannot be reconstructed without the missing step-by-step trajectories. The no-correction values are copied from the archived summary; its individual trial records are unavailable and it was not independently rerun. The comparison is internal to one synthetic simulator.
The median of the 100 trial median absolute errors is about 0.001582 m with correction. This is not the worst error, a pooled median of every update or a physical measurement precision.
An endpoint inside the chosen 0.25 m lateral band is not an arrival at a collision-free destination. A “recovery” is merely at least one sample inside the band in a subsequent window of up to 100 steps. It does not require sustained stability or even a preceding error outside that band. Some windows overlap, so 300 windows are not 300 independent trials.
The new gain-and-delay demonstration above is a different model. Its curves are not reconstructed traces of the older feature matcher.
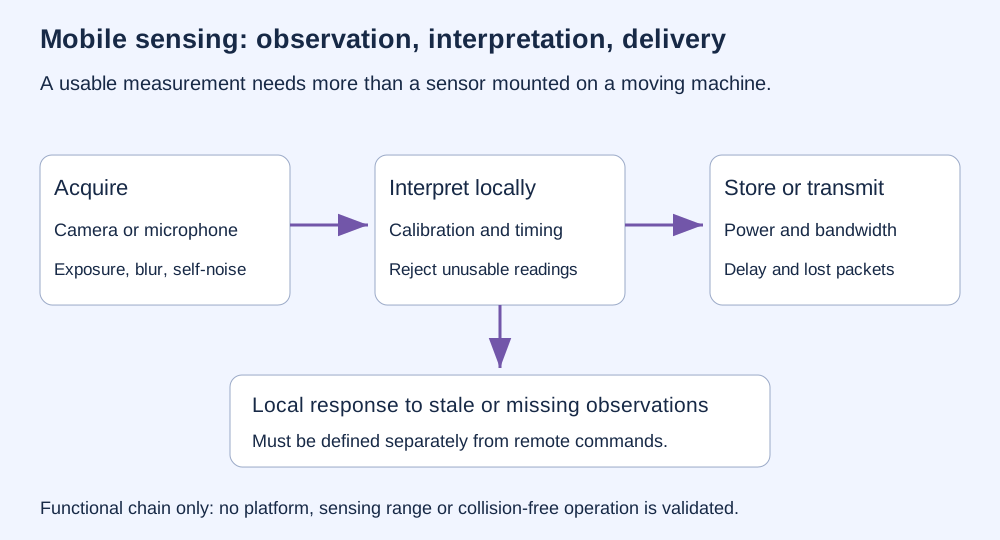
A camera's orientation, calibration, exposure and motion blur affect what an image means. Timestamps connect the image to the platform's position. A microphone also records motor noise, wind and vibration; recording more clearly is a different task from estimating position.
Processing, storage, power and communication all constrain the sensing chain. Sending an image elsewhere does not make it current: the robot may have moved before the answer returns. A received packet is not proof of a timely observation, and a command is not proof that the platform followed it.
CONSTANT SPEED · DELAY ONLY
At 1 m/s, 200 ms means another 0.20 m of travel. This is speed × delay. It excludes braking distance, sensor range, moving obstacles, slopes and changes in speed. It is not a safe-clearance recommendation or a certified stopping distance.
This section describes a real-world design concern; the page models do not include walls, ground clearance or collision avoidance. A route estimate cannot reveal every new obstacle. Close to a wall or the ground, sensing, clearance, reaction time and the ability to slow or stop must be evaluated together. Network coordination cannot replace a clearly defined local response when communication or sensing fails.
Nav2's Collision Monitor illustrates a separate software layer that responds to current nearby sensor information. Such software does not turn this page's tracking model into a certified safety system. A claim about accident probability would require a definition of an accident, an exposure denominator and independent evidence. No flight or passenger-safety result is established here.
Today: robots inspect equipment, transport materials and construct maps in suitable operating environments. Looking at each stage of the feedback loop helps diagnose whether a failure began with poor observations, a wrong estimate, a delayed command or insufficient control authority.
A future direction: combine better visual estimates with explicit handling of stale or missing observations. Test changing lighting, repeated landmarks and communication failures against an independent position reference. Improvement needs to hold beyond the scenario used to tune the controller.
REPRODUCIBLE STUDY
| Setting | What the model does |
|---|---|
| Gain zero | Never corrects; final error is 0.60 m after the assigned disturbances |
| Missing observations enabled | Applies exactly zero correction at updates 70–89 |
| Requested correction exceeds 0.05 m | Caps its magnitude at 0.05 m for that update |
e[k+1] = e[k] + clip(−K·e[max(0,k−d)], −0.05, +0.05) + w[k], starting at e[0] = 0.30 m. The gain K is dimensionless; d is an integer delay in updates. The disturbance w is +0.30 m at updates 40 and 150, −0.30 m at update 100, and zero otherwise. Requested corrections use the initial error when a delayed index would precede zero.
With missing observations enabled, updates 70–89 replace the correction with zero. The delay still describes the age of an available estimate on other updates. No estimator reconstructs missing information. No safety decision or physical halt is simulated.
The figures sample four gains (0, 0.4, 0.8, 1.6), three delays (0, 2, 5 updates), and both observation settings: 24 deterministic scenarios. The browser offers intermediate gains and delays using the same recurrence. Error at update 200 follows the 200 corrections; the largest sampled error includes the initial state.
These calculations are reproducible teaching examples. The old descriptor-matching benchmark and the new recurrence have different assumptions and must not be combined into a single robot-accuracy claim.