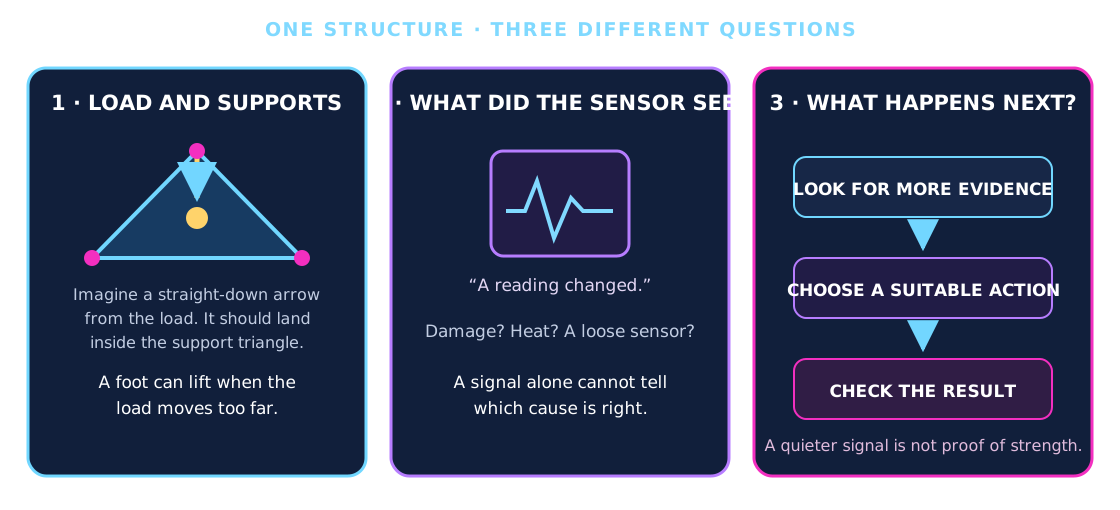
Imagine this
A table can tip if its heavy load moves too far past its feet. A sensor can notice a change, but it cannot tell us what caused it. People must inspect before choosing what to do.
THE FIELD GUIDE / 011 · STRUCTURES & MONITORING
Follow the load through three feet. Then explore why a sensor alarm does not tell you which repair will work.
These examples separate support geometry, detecting a change and verifying a repair. None is a structural safety certificate.
Move the load ↓A table can tip if its heavy load moves too far past its feet. A sensor can notice a change, but it cannot tell us what caused it. People must inspect before choosing what to do.
Pictures showing where the weight pushes hardest can help people decide what to inspect. A person still has to check what caused the change before choosing a repair.
These are static and synthetic examples, not measurements of a bridge, crack or repair. A warning alone cannot establish structural safety.
Read-aloud starter; not yet tested with children. The fuller science, data, figures and sources follow below.
THE SIMPLE VERSION · NO BACKGROUND NEEDED
Think of a little table standing on three feet. It can hold a camera. Move the heavy camera too far and one foot may lift. A sensor can notice that a reading changed, but it cannot tell by itself what caused the change.
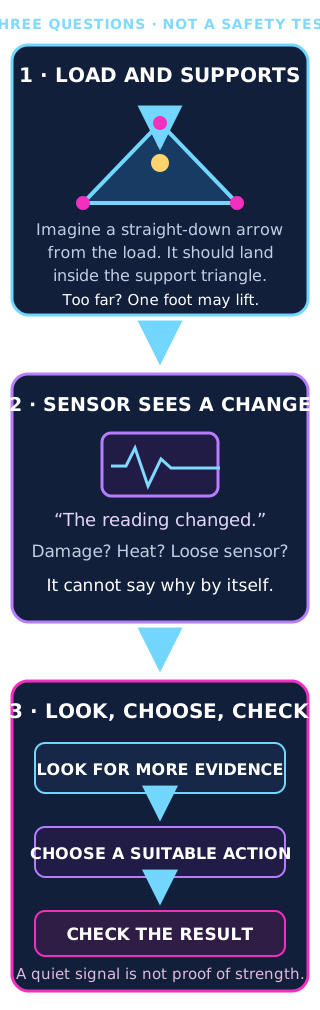
A table with three feet can rock if the vertical projection of its weight moves outside the triangle made by the feet. This simple drawing assumes a level, still table. It cannot say whether a real table, leg or patch of ground is strong enough.
Try moving the load ↓A sensor can say, “This reading changed.” It cannot say by itself whether the cause was damage, heat, a loose sensor or something else.
See what the sensor model assumes ↓People need more evidence before choosing what to do. After any action, they need to check the result. A quieter signal alone does not prove that a structure is strong again.
Follow the inspection steps ↓Why this could help: better load maps and clearer warnings may help teams decide where to inspect structures and when they need more evidence. The models below are calculations and synthetic examples, not measurements of a bridge, a real crack or a successful repair.
01 / CONTACTS CAN PUSH, NOT PULL
A rigid platform rests on three unanchored points in a horizontal plane. Move the vertical projection of its centre of gravity. Each foot can push upward, but it cannot pull the platform down.
| Foot | Formal fraction | Reaction (N) | Pressure (kPa) |
|---|
At the centre (0, 0), 100 kg gives 326.89 N per foot. On an edge, at least one foot unloads. Outside, a negative mathematical fraction means the assumed equilibrium is impossible; it is not a physical downward contact force.
ΣR = mg · ΣRx = mgxCG · ΣRy = mgyCG
Coordinates are A=(−1,−0.6), B=(1,−0.6), C=(0,1.2) metres; g=9.80665 m/s². Only vertical gravity and contact reactions are included. The signed margin is the minimum inward perpendicular distance to an edge line. Outside the triangle it measures a violated boundary, not necessarily the shortest distance to the triangle.
At zero margin equilibrium is marginal, not a robust operating target. Mass scales reactions but does not move the geometric boundary. Pad area changes nominal R/A pressure; it does not change the fixed point-contact geometry. Soil bearing capacity, true pressure distribution, settlement, leg strength, wind, slope, friction and impact are absent.
02 / THREE FEET DO NOT SOLVE EVERY TERRAIN
Three points define a plane, but real uneven-ground support still needs sufficient leg travel, reliable locks, strength and suitable contact with the ground. This calculator keeps all contacts level; it does not simulate levelling or landing.
Moving a payload can unload a foot even if total weight stays the same. A lower centre of gravity helps against a lateral overturning moment, but does not change this gravity-only level-plane result when its horizontal projection is unchanged.
A bigger effective pad area reduces average pressure for the same force. It does not establish that soft ground will support the load without sinking.
Touchdown, vibration and sudden motion involve acceleration and compliance. A point inside the static triangle is not a general guarantee against tipping or structural failure.
03 / AN ALARM DEPENDS ON THE CHANGE
In this synthetic model, reduced stiffness under fixed load increases strain; at fixed mass it lowers a natural frequency. Two standardized sensor residuals are combined. The model is not a measured crack, real sensor or tested beam.
This first calculation assumes independent Gaussian channels.
This separate calculation keeps the original threshold while changing correlation. It does not change the detection calculation above.
Temperature, loading, mounting and timing can affect both channels together. Combining two readings does not automatically provide two independent pieces of evidence.
The baseline strain is 500 microstrain; read noise is 11 microstrain; temperature compensation leaves a 0.5 °C standard deviation multiplied by 12 microstrain/°C. Modal-frequency relative noise is 1%. With retained stiffness r, the assumed mean strain change is 500(1/r−1); fractional frequency drop is 1−√r.
Each change is standardized by its noise scale. The score (zstrain+zfrequency)/√2 is compared with 4.686602. Independent healthy standard-normal channels give a standard-normal score. Correlation c changes score variance to 1+c, so the same threshold admits more false alarms. Windows occur once per second; real temporal clustering is not modelled.
04 / KEEP THE FAILURES IN THE RECORD
| Scenario | Observed count | Estimate | One-sided 95% bound |
|---|---|---|---|
| Healthy, 1,000 hours | 5 / 3,600,000 windows | 0.5 alarms / 100 h | Upper: 1.0513 / 100 h |
| 10% stiffness loss | 19,652 / 20,000 detected | 98.26% recall | Lower: 98.101% |
| 4% stiffness loss | 364 / 20,000 detected | 1.82% recall | Lower: 1.671% |
The confidence-based false-alarm check fails: the upper bound exceeds the proposed limit of one alarm per 100 hours, even though the observed rate is lower. The 10% damage scenario passes the proposed 95% recall lower-bound check; the 4% scenario fails. This does not establish a universal minimum detectable crack size.
Recall bounds use one-sided Wilson intervals. The alarm upper bound uses a constant-rate Poisson rare-event approximation to independent window counts. Real drift, dependence and clustered alarms can invalidate those assumptions. These intervals quantify sampling under the model, not uncertainty about whether the model describes a real structure.
05 / FIGURES, DATA AND METHODS
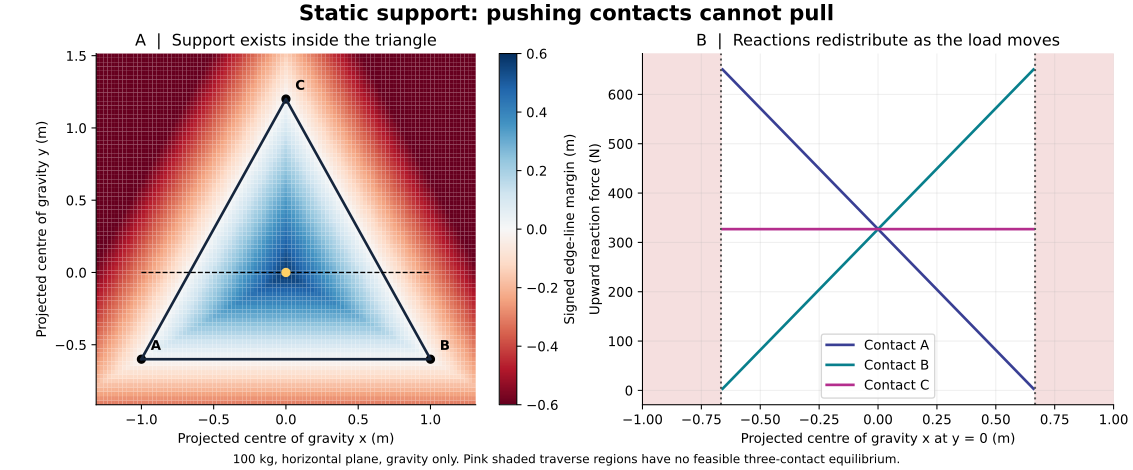
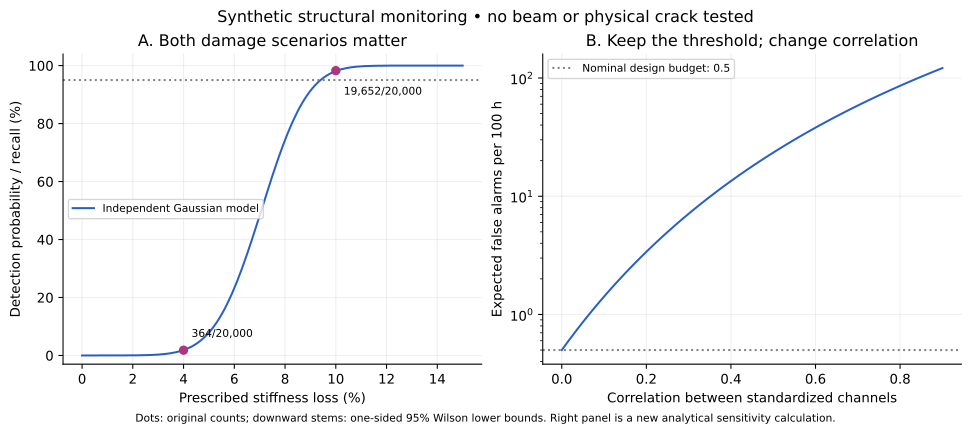
Support reproduction needs Python, NumPy and Matplotlib; monitoring needs Python and Matplotlib. Scripts regenerate the figures and data. Deterministic support curves do not have sampling error bars. Monitoring bounds describe synthetic sampled outcomes under stated assumptions.
06 / DETECT → INSPECT → DECIDE → VERIFY
A change may come from load, temperature, a loose sensor or damage. Detecting it does not identify a crack, locate it accurately or select a repair.
Routing a tool or capsule to a location is a logistics task. Even perfect delivery would not prove adhesion, material compatibility, restored strength or durability. No automatic repair mechanism is validated here.
Check calibration and operating conditions, then seek independent inspection evidence. Record uncertainty and allow an “undetermined” result when evidence is insufficient.
Repair, replacement, further inspection or taking equipment out of service are different decisions. This educational model cannot authorize any of them for a real structure.
Define acceptance criteria before repair, inspect the result and reassess function using suitable engineering methods. A quieter sensor signal alone does not prove restored strength.
07 / WHAT THIS CAN IMPROVE
Support calculations help explain instrument-platform load placement. Monitoring studies help compare detection and false-alarm tradeoffs. Inspection workflows help prevent an alert from being mistaken for a diagnosis.
A proposed validation study would use calibrated sensors, independently characterized specimens and held-out conditions, including environmental changes and healthy controls. Criteria should include false-alarm uncertainty and small-change sensitivity. Such physical testing is not reported on this page.
READ FURTHER
Orsolino et al. · Feasible Region explains why actuator constraints may restrict support beyond simple geometry.
MIT · Contact and balance develops the force-balance framework and dynamic limits.
NIST · Proportion confidence intervals supports the Wilson method.
NIST · Constant-rate count model explains count/exposure confidence limits.
Liu et al. · Monitoring under environmental variation is primary research on the importance of changing conditions; it does not validate our synthetic benchmark.
NASA Technical Note D-7664 · Dynamic tests of three-legged lander models reports eight defined landing conditions for two different three-leg systems. NASA examined stability, loads and strut travel; the record warns that the models are not directly comparable because their geometry and mass differed. This is a useful example of what dynamic testing adds beyond the static support-triangle model above; it does not validate that model or any design shown here.
Revised 28 September 2026. Educational static and synthetic models, not a structural assessment or demonstrated repair system.