Imagine this
A film can keep a pattern beside a picture. Light can read that pattern later. If the film is played at the wrong speed, the voices sound wrong.
THE FIELD GUIDE / 023 · RECORDING
A useful record preserves a signal and the rules needed to recover it. Timing, representation and the reading mechanism all matter.
A film can keep a pattern beside a picture. Light can read that pattern later. If the film is played at the wrong speed, the voices sound wrong.
Optical sound recording is a documented engineering approach. The page's timing model helps explain playback errors, not design a tested recorder.
Calculations cover ideal timing and geometry; they do not measure sound quality, scanner accuracy or recording capacity.
Read-aloud starter; not yet tested with children. The fuller science, data, figures and sources follow below.
A sound vanishes as the vibration passes. A record keeps a physical pattern that can stand in for that sound later. But making a mark is only half the task: someone must know how to read it, at what speed and with what interpretation.
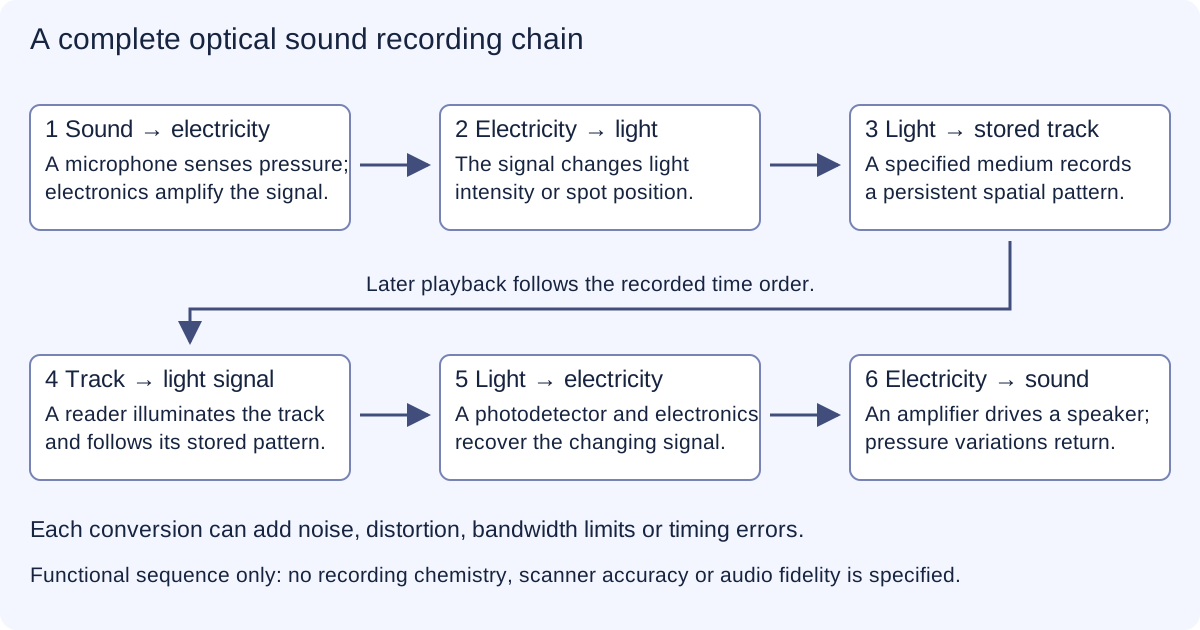
A microphone converts changing sound pressure into an electrical signal. After amplification, that signal can control the brightness or position of a light spot. A suitable medium stores the resulting pattern. During playback, a light source and detector read changes in the pattern; electronics and a loudspeaker turn them back into sound.
Each stage can lose information through limited bandwidth, noise, distortion or saturation. The optical carrier frequency is not the rate at which the sound changes. A very high optical frequency does not mean a recording contains an equally high audio bandwidth. Bandwidth is the range of signal frequencies a stage can preserve; dynamic range separates its weakest usable signal from the largest signal it can handle without overload. Wider-band electronics alone do not add information that the microphone never captured.
On a moving strip, a second of sound occupies a length of track. Read the track at the wrong speed and timing changes. A stationary plate can instead be scanned by a moving light spot. The medium remains still, but the reader still needs an accurate path and clock. Optical scanning of recorded sound is a documented engineering approach. Primary optical-recording patent
TRY THE TIMING MODEL
Imagine a reader making regular turns while a timing offset accumulates. The chosen angle is the scanner's final phase error, not the phase of the sound wave. The same time offset spans more cycles of a higher-frequency tone.
These outputs are unit conversions for the chosen offset. They do not predict perceived quality or hardware tolerance. In the numerical study below, delay grows linearly over two seconds, causing a time stretch and frequency mismatch. That deterministic drift is different from random jitter.
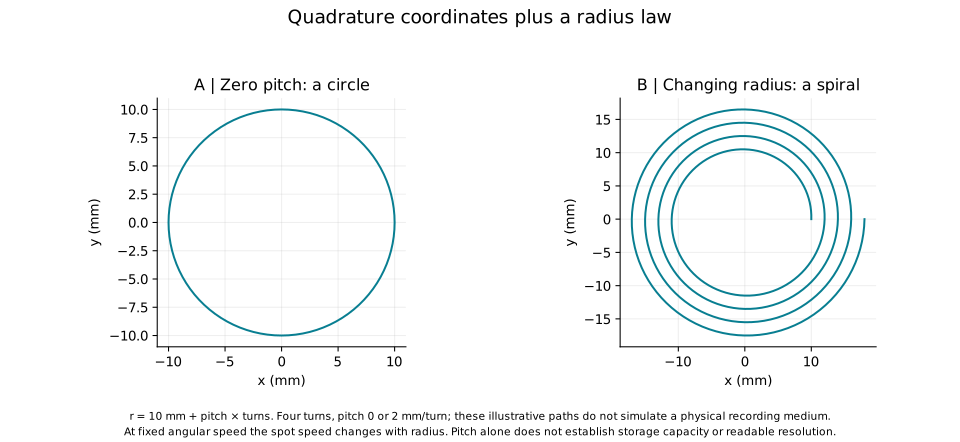
A circular scan uses two coordinated motions at right angles. Increase the radius as the spot goes around and it traces a spiral. Neighbouring turns need enough separation for the spot and tracking errors. More turns on a drawing do not automatically mean more usable recording capacity.
The reader must follow the right place at the right time. A spiral shape alone does not provide a reference clock, correct drift or keep the spot on track. A study of timing error also does not measure the mechanical or optical accuracy of a scanner.
TRY THE GEOMETRY
This mathematical path starts at 10 mm radius and makes five turns. Pitch means radial advance per turn.
Outer radius: .
The drawing assigns no beam width, medium grain or tracking error. Pitch alone cannot establish resolution, duration or recording capacity. A visible waveform or spiral is not a hologram: no optical wavefront is recorded by this drawing.
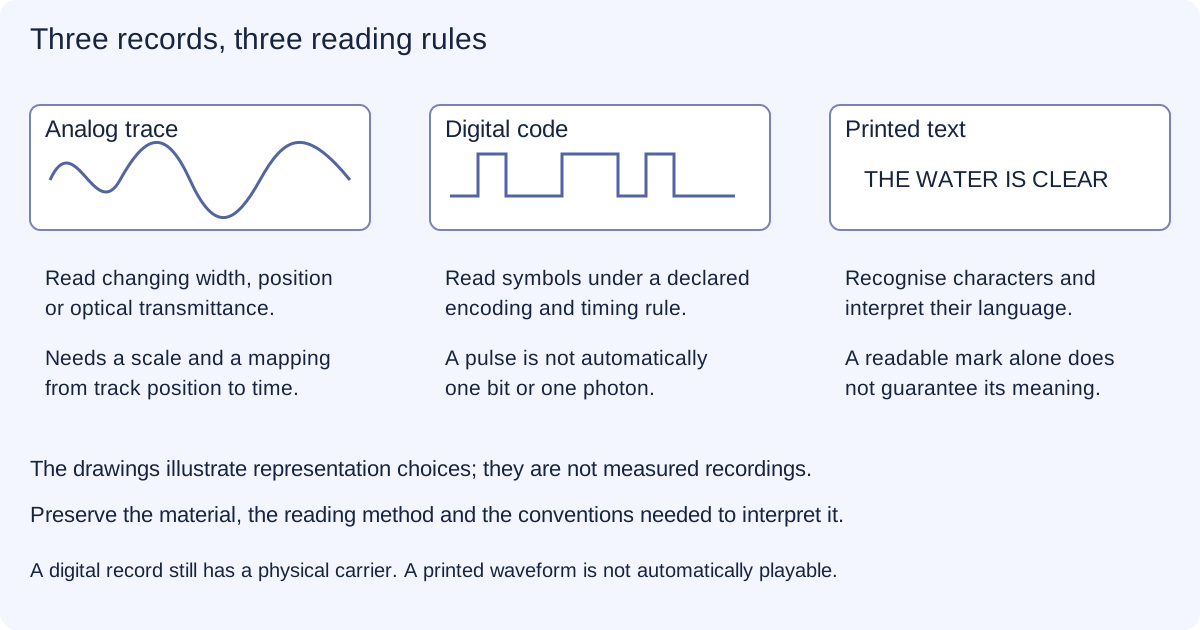
A physical pattern can store information without continuously transmitting it. To read it, a system needs a sensing method, a timing convention and a code or interpretation. Counting pulses tells us how many events a chosen schedule contains. It does not tell us how many bits were recovered or what the message says.
An analog optical track varies with the signal. A digital code uses defined symbols. Printed words require yet another interpretation. Keeping a record useful therefore means preserving its format and reading method as well as the material itself.
Assign a schedule of 40 pulses per second. Count pulses at times k/40 seconds, for positive integers k up to the selected duration.
This does not count photons or decoded bits. Bits per symbol, framing, error correction, missed events and the codebook would need separate definitions. A recording medium may store a pattern without emitting any ongoing pulse stream.
A stated period of activity describes an operating window, not a radioactive half-life. A half-life concerns how a decaying population changes with time; it needs an identified process and evidence for that decay model. Neither a pulse count nor a stated operating duration supplies it. Recovering a message and locating its source are also different tasks: position needs additional measurements and a defined positioning method. No emission-lifetime or tracking experiment is supplied here.
In electrophotography, light changes a charge pattern on a prepared surface. Toner develops the pattern, transfers to paper and is fixed there. This is an established sequence, with a distinct job for each stage. Xerox process explanation
Direct thermal media change appearance when locally heated. Thermal-transfer printers instead transfer material from a ribbon; ink printing deposits ink. These are different mechanisms even when the resulting text looks similar. The chemistry, contrast and durability need to be specified for the chosen medium. A generic description of colour formation cannot establish a new process. Zebra direct thermal guidance
| Method | How the mark is formed | What must be checked |
|---|---|---|
| Electrophotography | Charge, light exposure, toner development, transfer and fixing | Charge control, development, transfer and fixation |
| Direct thermal | The prepared medium changes appearance under local heating | Medium chemistry, contrast and durability; no generic lifetime assumed |
| Thermal transfer | Material transfers from a ribbon | Ribbon and substrate compatibility |
| Ink deposition | Ink is deposited onto the surface | Wetting, drying or curing, adhesion and fading |
Understanding the chain helps diagnose a distorted recording, choose a suitable printed record and preserve information that future readers can still recover. Better tracking or calibrated digitisation may improve recovery from a readable record, but improvement must be compared with a known reference. A sharper-looking trace or a plausible playback is not automatically a more faithful record.
The figures and simulations here illustrate selected signal and timing relationships. They do not demonstrate a new recording medium, a complete physical scanner or a measured archival lifetime.
REPRODUCIBLE STUDY
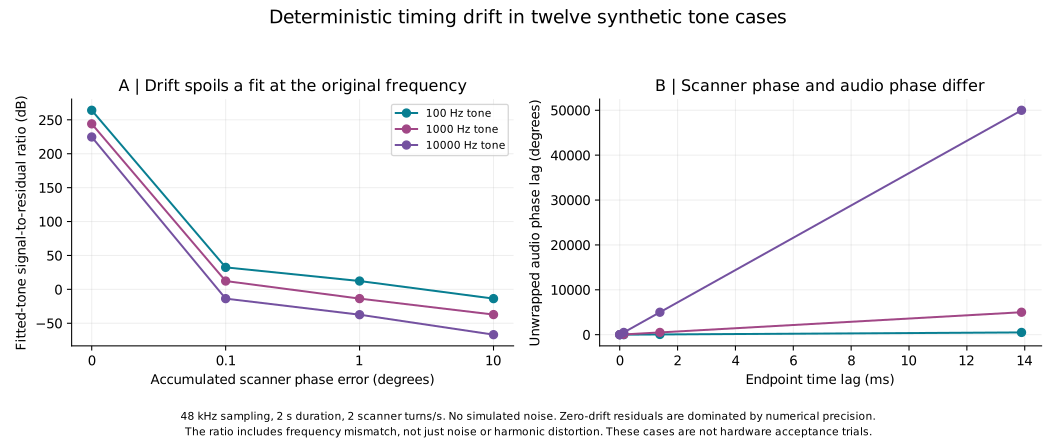
The study includes the same twelve tone cases shared by the scanning and playback lessons, plus 1,602 separate geometry samples. Reproducing the former calculations does not create a second independent experiment.
The benchmark records synthetic tones at 100, 1,000 and 10,000 Hz, sampled at 48 kHz for two seconds. For each tone, scanner drift ends at 0, 0.1, 1 or 10 degrees, with two turns per second. These are twelve shared cases, not two separate experiments.
The reproduced signal is fitted to sine and cosine components at the original tone frequency. The residual includes frequency mismatch from deterministic drift. It is therefore not an isolated noise measurement or harmonic-distortion measurement. Signal-to-residual ratio and relative residual RMS describe the same residual in different units; they are not independent tests.
The readout model uses linear interpolation and a one-pole recurrence with coefficient a = 1 − exp(−2π·20,000/48,000). The 20,000 parameter is not asserted to be the exact digital −3 dB cutoff. The first 100 ms are excluded from the fitted comparison. No physical scanner, recording medium, added random noise or listening study is represented.
Endpoint delay is Δt = φ/(360ν), with scanner phase φ in degrees and turn rate ν in turns per second. The corresponding audio phase magnitude is 360fΔt degrees. For the spiral, r(θ) = r₀ + pθ/(2π), x = r cos θ and y = r sin θ. Its geometry does not supply the missing physical readout system.
To demonstrate a real improvement, compare independently recorded reference signals, characterize the reader and preserve raw data. A pleasing playback or a dense track drawing alone does not establish faithful recovery.
Developing a visible powder image is one stage. Transfer, fixing, colour, fine detail, raised marks and different receiving surfaces require their own checks. A promise that one method handles all of them is not an output test. The material's fate matters too: making a sheet dissolve does not show that its ingredients were recovered, that the remaining liquid is harmless or that the full process uses fewer resources.
A recording strip may need to withstand an electric field without electrical breakdown. That does not tell us how quickly heat passes through it. Electrical breakdown strength and thermal conductivity are different properties, and both must be checked under the conditions relevant to the material. Neither property alone establishes recording sensitivity, playback quality or durability.