Imagine this
It is easier to hear a friend when the friend is louder than the room. Turning up a whole recording makes both voice and noise louder. Two sounds can cancel in one place and become louder somewhere else.
THE FIELD GUIDE / 006 · SOUND
A voice can be loud and still be hard to understand. Which part of the message survives the journey?
Follow three different problems: making a signal stand out, controlling a sound wave at one location, and shaping a source into a richer sound. Each calls for a different kind of intervention.
Start with the simple version ↓It is easier to hear a friend when the friend is louder than the room. Turning up a whole recording makes both voice and noise louder. Two sounds can cancel in one place and become louder somewhere else.
The examples can help people reason about clearer recordings, listening spaces and assistive communication. A room or device needs tests with people and speech.
These are simple sound-wave models, not tests of speech, a medical device or a particular room. A real room or device needs testing with people and speech.
Read-aloud starter; not yet tested with children. The fuller science, data, figures and sources follow below.
THE SIMPLE VERSION · THREE DIFFERENT SOUND PROBLEMS
Imagine trying to hear a friend while other people are talking. There are several ways to help, and they do different jobs.
Make the friend louder before the sounds mix, or quiet the background. This can make the voice easier to pick out.
If the voice and noise are already together, turning up the whole recording makes both louder. It does not separate the sounds.
Two matching sound waves can partly cancel at one spot. A few steps away they might add together and sound louder.
See the wave modelA filter can make some parts quieter. It cannot create a note that the sound did not contain. This small model is not a test of speech or a medical device.
See the source-and-filter exampleThese ideas could help people make clearer recordings, improve listening in rooms or study assistive communication. The examples below show basic sound physics; they do not promise that a particular room or device will work.
01 / A CLEANER PATH FOR THE MESSAGE
A desired voice arrives at an illustrative level of 60 dB before any gain. Background sound and a competing talker arrive at the same receiver. Change the surroundings, increase only the desired source, or amplify the whole recording.
The first gain changes only the desired source. The second acts after voice and noise have mixed.
Exports the selected controls and calculated outputs for all three teaching models.
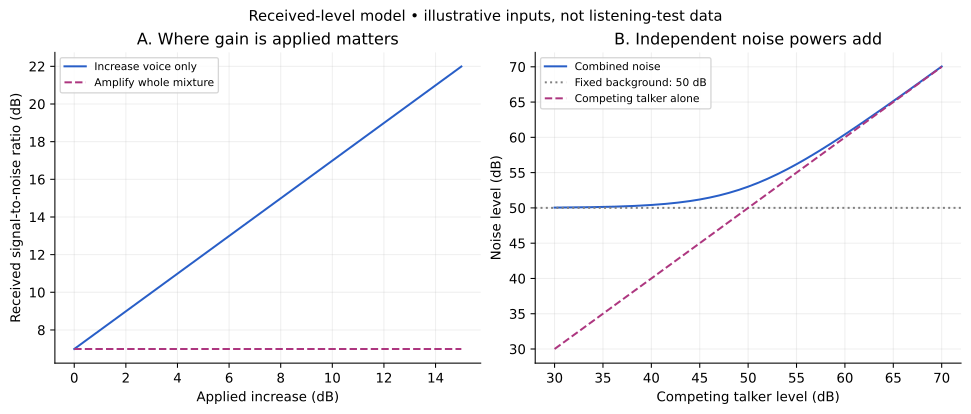
Solid blue: increasing the desired source alone. Dashed pink: increasing the already mixed recording. Curves use the selected background and competing-talker levels, with each type of gain varied separately from zero.
SNR is not a percentage of words understood. Timing, frequency content, reverberation, hearing and the message itself also matter. These are band-matched, unweighted illustrative levels at one receiver, not calibrated measurements or listening recommendations.
Decibels express a logarithmic ratio. For two mutually uncorrelated noise components with the same reference and frequency band, add their mean-square pressures before converting back to decibels: Lₙ = 10 log₁₀[10^(Lᵦ/10) + 10^(Lₜ/10)]. Two equal components double the mean-square pressure, adding 3.0103 dB.
The signal-to-noise ratio is Lᵥ − Lₙ. An ideal common gain adds the same number of decibels to both, so the difference is unchanged. Clipping, quantization and additional electronic noise are excluded. Coherent waves require an interference term; the next experiment includes it.
02 / BEFORE REACHING FOR AN ALGORITHM
A quieter place, a quieter time or a better source–microphone arrangement can change the mixture before it is recorded. The time of day or number of people is only a proxy: check the sound at the actual receiver.
A filter can separate signals in different bands. Real voices often occupy overlapping bands, so removing a band may remove wanted speech too. Masking can also depend on when sounds occur.
If a recorded sample is y = s₁ + s₂, many pairs of sources give the same y. A sample of 5 could be 2 + 3 or 1 + 4. Recovery needs additional observations or assumptions; turning up y does not supply them.
Different arrival directions and delays can help distinguish sources. Their geometry, synchronization and acoustic environment matter; an array does not guarantee separation.
03 / A QUIET POINT IS NOT A QUIET ROOM
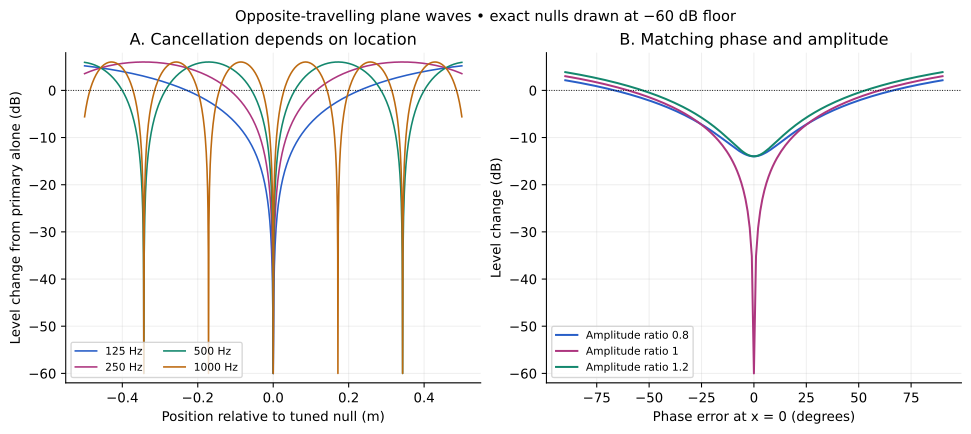
Two single-frequency plane waves travel in opposite directions. The second is tuned to oppose the first at position zero. Change the frequency, matching or listener position to see where pressure decreases—and where it grows.
Below 0 dB: reduced pressure level. Above 0 dB: reinforcement. The dot marks the listener. The graph stops at −60 dB for readability; that is a display floor, not a measured attenuation. An exact mathematical null has zero pressure ratio and a level ratio of −∞ dB.
p₁ = A cos(ωt − kx), p₂ = −rA cos(ωt + kx + ε), with k = 2πf/c and c = 343 m/s. The total RMS pressure relative to the primary alone is √[(1 − r)² + 4r sin²(kx + ε/2)]. Level change is 20 log₁₀ of that ratio.
With equal amplitudes and no phase error, x = 0 is a null. At one quarter-wavelength away, the pressure amplitudes add and the level rises by 6.0206 dB. These positions belong to this particular opposite-travelling-wave geometry.
This is a lossless, one-dimensional, single-frequency field with prescribed waves. It has no room reflections, geometric spreading, feedback algorithm, microphone errors, adaptation, latency or loudspeaker limits. A spatial mean of pressure squared is not the same as energy flux in a standing-wave field.
04 / THREE DIFFERENT TOOLS
These interventions act on different parts of the sound path. Choosing one starts with identifying whether the problem is reflection, transmission or a controllable wave at a specific receiver.
A suitable treatment can reduce reflected sound. It does not erase the direct path from the source, and its performance varies with frequency.
A barrier and its leaks determine how sound passes between spaces. A material that absorbs well is not automatically an effective transmission barrier.
A secondary source can oppose pressure in a controlled region. Measurements away from the target are needed too: reducing a tone at one point can increase it elsewhere.
Changing a material’s absorption with its state would need measured frequency-dependent absorption data. Generating sound through time-varying heating is another mechanism, with its own thermal response and efficiency. Neither capability is demonstrated by the wave model here.
A PATENTED ARRANGEMENT · NOT A PERFORMANCE TEST
Simple version: imagine a closed box with two small speakers and a microphone inside. The speakers make a chosen sound in the box; the microphone records it. The design aims to keep outside sound and inside sound apart. That is a different job from cancelling noise across a whole room.
U.S. Patent 6,434,240 B1 describes a sound-isolation cabinet with two sound sources and a microphone. Its claims and four drawings disclose several arrangements. The patent tells us what was proposed and claimed; this document contains no measured sound-isolation results, frequency-response data, uncertainty analysis or independent replication. A patent drawing is not proof that a working cabinet achieved the intended result.
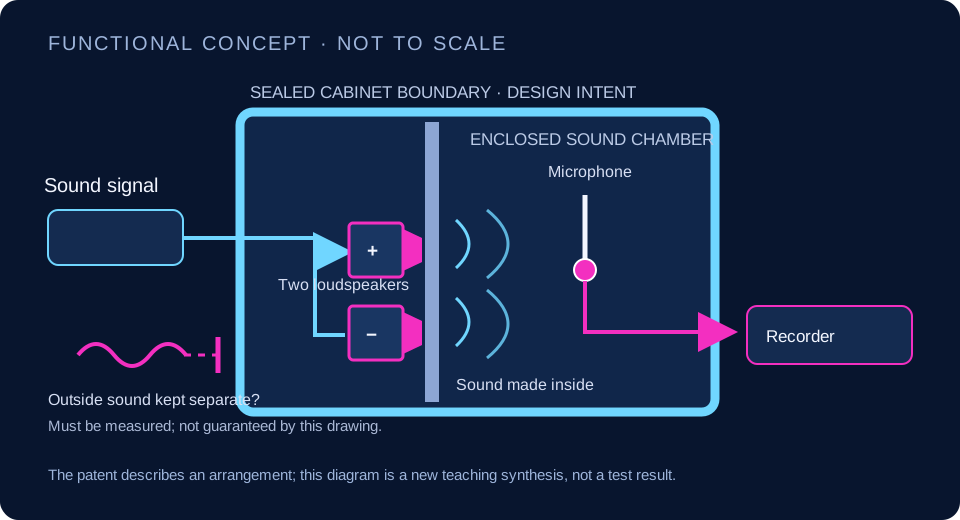
If the enclosure isolates sound well enough while preserving the sound being measured, it could help with a recording or laboratory comparison. This page does not establish that benefit for any built cabinet.
Measure sound transmission through the cabinet in frequency bands, at several positions and for several source directions. Calibrate the microphone and speakers, check leakage at joints and cable openings, and measure whether the two speakers create unwanted peaks or nulls. Compare the recorded signal with a reference microphone in a controlled room. Report the apparatus, background level, uncertainty and repeat-to-repeat variation. A patent description alone supplies none of those results.
See the patent record and its claims, or review this application’s open status in the idea register. The existing wave model is a separate ideal example of local cancellation; it does not simulate this cabinet.
05 / A SOUND NEEDS A SOURCE AND A SHAPE
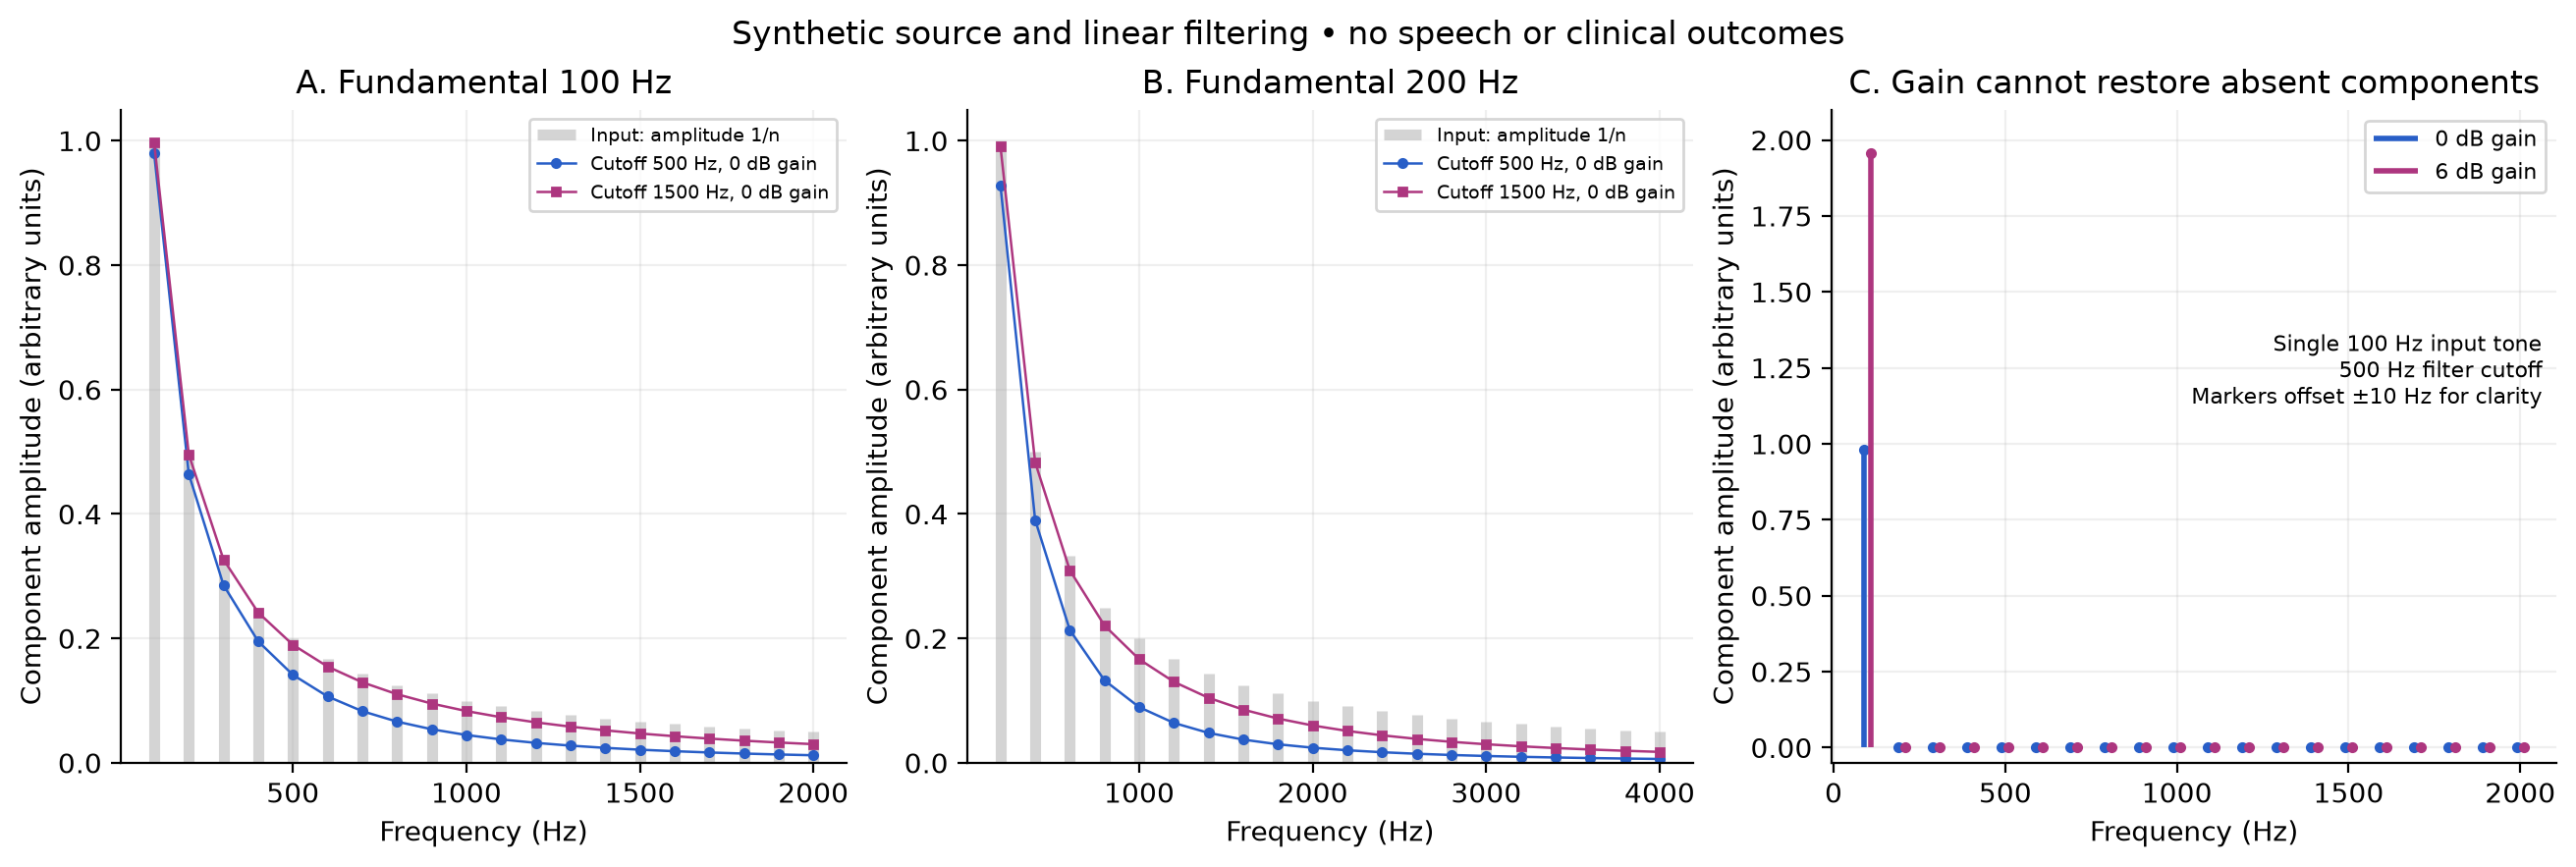
A repeating source produces a fundamental frequency and harmonics at its integer multiples. A filter changes their relative strengths. Explore a synthetic source and a simple electronic low-pass filter; this is not a simulation of an individual voice or a clinical device.
Amplitudes use arbitrary units. No audio plays; compare the plotted components.
Dashed pink stems: input. Solid blue stems, slightly offset: filtered and amplified output. Frequencies remain integer multiples of the selected fundamental. Compare heights within a plot; its vertical scale stays fixed.
The source amplitudes are 1/n for harmonic n. The first-order filter has magnitude |H(f)| = 1/√[1 + (f/f꜀)²]. Gain G multiplies amplitudes by 10^(G/20). It changes neither the harmonic frequencies nor an exactly absent component.
Voiced speech involves an excitation source shaped by the vocal tract. An external vibration source can provide excitation for articulation to shape. An amplifier instead increases a signal that already exists, while a sensor–link–speaker relay transports a signal. Those are different functions.
This periodic source and one-pole electronic filter are deliberately simple. Real speech includes resonances, changing articulation and unvoiced sounds that this model omits. No intelligibility, personal suitability, medical outcome or replacement device is evaluated.
INSPECT YOUR SETTINGS
| Position (m) | RMS pressure ratio | Level change (dB) |
|---|
| Harmonic | Frequency (Hz) | Input (a.u.) | Output (a.u.) |
|---|
06 / ANALYTICAL STUDIES
NEW DETERMINISTIC CALCULATIONS · NO LISTENING TESTS OR ROOM MEASUREMENTS
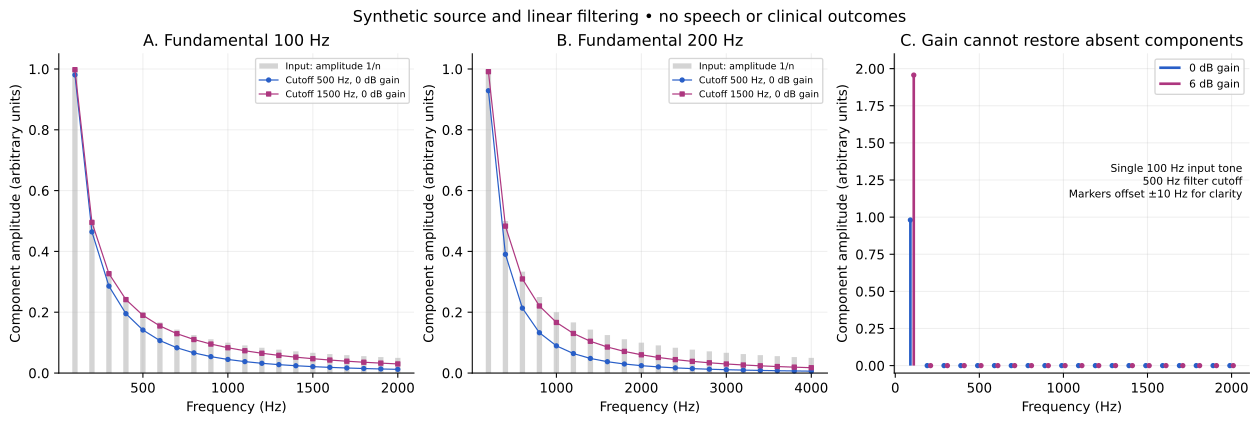
Run each reproduction script with Python 3 and Matplotlib in its own folder. It writes figures and data beside itself. The supplied datasets are calculated values, not independent repeated experiments; no empirical confidence intervals are attached.
07 / A HUMAN FEEDBACK LOOP
A meter can help, but success means recovering the intended message. Separate the acoustic measurement from the outcome you actually care about.
Example: reducing a 50 dB background to 40 dB while another 50 dB talker remains changes combined noise from 53.01 to 50.41 dB. The improvement is only 2.60 dB: the remaining source now dominates. Removing one obstacle does not remove every obstacle.
Document source and receiver positions, frequency band and the measurement reference. Check background, clipping and microphone response. Record a test phrase at the actual listening location.
Try a quieter background, a source adjustment or a treatment separately. Record again with comparable conditions; keep the original recording for comparison.
Use an unseen phrase and a defined transcription task to assess message recovery, separately from levels. Repeat across positions and conditions; report errors and variation. For cancellation, include positions outside the target region.
This is a proposed evaluation procedure. No listening experiment, autonomous controller or clinical trial has been performed for this chapter.
08 / WHAT THIS COULD IMPROVE
Compare room conditions and microphone placement before relying on post-processing. Assess whether people recover the message.
Measure both cancellation and reinforcement around a controlled location. Frequency and placement determine what a local result means.
Identify which function is needed before evaluating a device. A harmonic teaching model cannot establish someone’s clinical needs or a device’s benefit.
READ FURTHER
NIST · Speech signal-to-noise measurements provides measurement context; the page is archived. The formulas here explicitly state their own assumptions.
NIST · Audio quality research distinguishes communication quality and intelligibility testing.
University of Southampton · Applications of interference explains secondary-source cancellation.
OSHA Technical Manual · Noise mechanisms describes absorption, direct and reflected paths, and transmission barriers.
NIDCD · How voice and speech are produced supports the source-and-shaping explanation; it does not validate the synthetic filter as a vocal tract.
Revised 27 September 2026. Original analytical teaching studies; no room-performance or clinical validation.
The proposal goes further, claiming the same absorption at every acoustic frequency, reversible changes of the absorbing material and a thermal source with no inertia. No measurements establish those properties. An alternative sound-level scale would also need a defined reference and conversion before its readings could be compared. The wave demonstration does not test any of these material or source claims.
A SENSOR IDEA / CALCULATED TEACHING MODEL
The very simple version: Think of three swings. Each moves most easily when you push with a particular rhythm. Tiny moving parts can also respond differently to low and high sounds. But three favourite notes do not automatically make a microphone that hears every note equally well.
Resonant acoustic arrays have been built and studied. They could help engineers select frequency bands for sensing or sound control. This example explains the mechanical response only; it does not predict clearer speech, a quieter room or a working design.
More damping reduces the sharp response. Natural frequencies stay fixed at 250, 500 and 1,000 Hz. The response peak can lie below the natural frequency.
On a small screen, scroll the graph sideways. The table below gives the selected values.
Channels: 250 Hz · 500 Hz · 1,000 Hz. Each channel is also named in the table.
| Natural frequency | Displacement / static displacement | 20 log₁₀ of that ratio |
|---|
Each independent linear oscillator follows m x″ + c x′ + k x = F₀ cos(2πft). With r=f/f₀ and damping ratio ζ=c/(2√(km)), steady-state displacement normalized by F₀/k is H=1/√[(1−r²)²+(2ζr)²]. At f=0, H=1; at f=f₀, H=1/(2ζ). The chart shows 20 log₁₀H relative to the static displacement of each channel, not dB SPL, electrical sensitivity or a common displacement in metres.
The study below assigns two damping ratios and three natural frequencies. Its RMS-across-channels curve is a descriptive mathematical summary, not an electrical sum or a prediction of microphone output. Combining real signals requires their phases, gains and wiring. Changing damping here does not model a specific physical adjustment to a device.
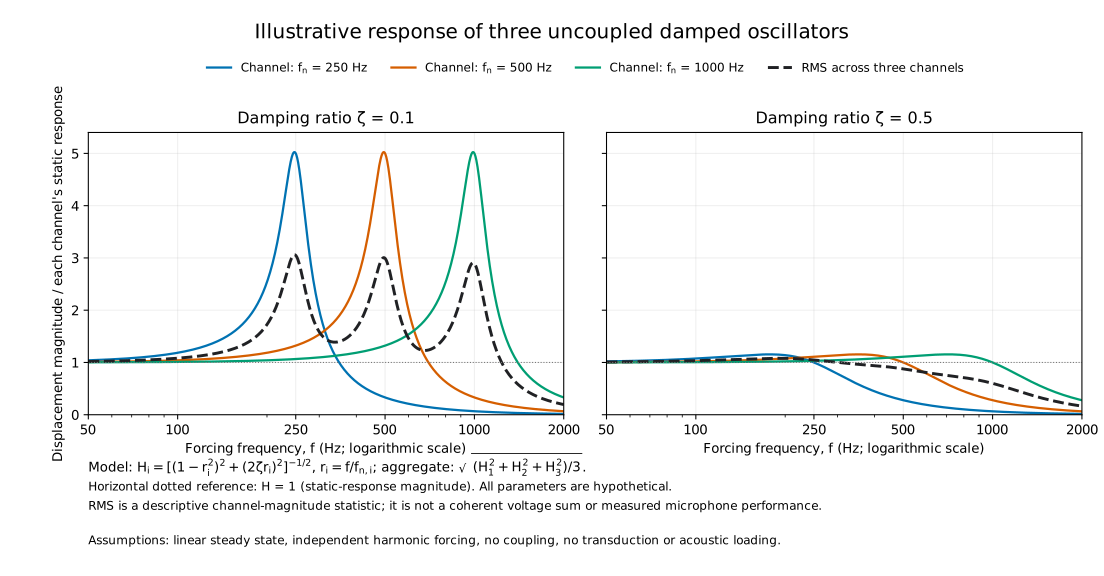
Scientific figure · PDF · Calculated curves · CSV · Reproduce the study · Python · Methods and parameters · JSON
What this leaves out: acoustic coupling and effective area, element coupling, transduction, electronic loading, noise, distortion, manufacturing variation and settling time. Large normalized motion does not prove high electrical sensitivity or low detectable sound pressure. A narrow frequency response cannot separate two sounds at the same frequency.
What a real project must show: calibrated output versus sound pressure and frequency, background noise, distortion, channel-to-channel variation and a defined combination method. An application such as monitoring a machine's tone would also need representative recordings and measured false alarms.
Sources: MIT: damped driven oscillation; Liu et al. (2020): an experimental MEMS resonant microphone array; Analog Devices: microphone sensitivity conventions. Parameters above are assigned teaching inputs, not extracted from that experimental device.
Open question and missing evidence in the idea register. The original proposal remains insufficiently documented; this lesson does not validate its cell count, bandwidth or sound thresholds.