Imagine this
A thermometer compares what it senses with temperatures we already know. It uses that comparison to show a number. The number is useful only in the conditions the thermometer was checked for.
THE FIELD GUIDE / 017 · TEMPERATURE
Put a thermometer in a warm drink and give it time to warm up. The little sensor changes, and the screen uses a checked scale to turn that change into a temperature.
The sensor must touch the thing we want to measure, and the scale must match the sensor. Start with the simple path, then explore two made-up examples—not readings from a tested thermometer.
Start with the simple version ↓A thermometer compares what it senses with temperatures we already know. It uses that comparison to show a number. The number is useful only in the conditions the thermometer was checked for.
Today, calibration and uncertainty help people decide whether a temperature reading suits a task. Better measurement plans can prevent misplaced trust in a display.
Calibration applies under stated conditions. This page does not certify a specific thermometer or every environment.
Read-aloud starter; not yet tested with children. The fuller science, data, figures and sources follow below.
THE SIMPLE VERSION · NO MATHS NEEDED
Imagine checking a warm drink. The thermometer's tip touches the drink, and the sensor warms up. A tiny part inside changes when it gets warmer. The screen reads that change and uses a scale to show a number.
The sensor needs time to get close to the drink's temperature. A quick reading may come too soon.
A sensor property changes with temperature. The screen cannot read temperature directly; it reads a signal.
People compare the signal with known temperatures. This check is called calibration. It helps turn the signal into a useful estimate.
If the sensor does not touch well, is still warming, or has a shifted signal, the number can be off. Better measurements help people control ovens and experiments, but the sensor and its calibration must suit the job.
See how a small signal shift changes the number · See what a switch can tell us
A sensor property changes with temperature. A reader measures that property and a calibration assigns a temperature scale. Poor contact, gradients or response delay can leave the sensor at a different temperature from the object. Measuring can itself deposit heat.
01 / A FIXED OFFSET IS NOT RANDOM SCATTER
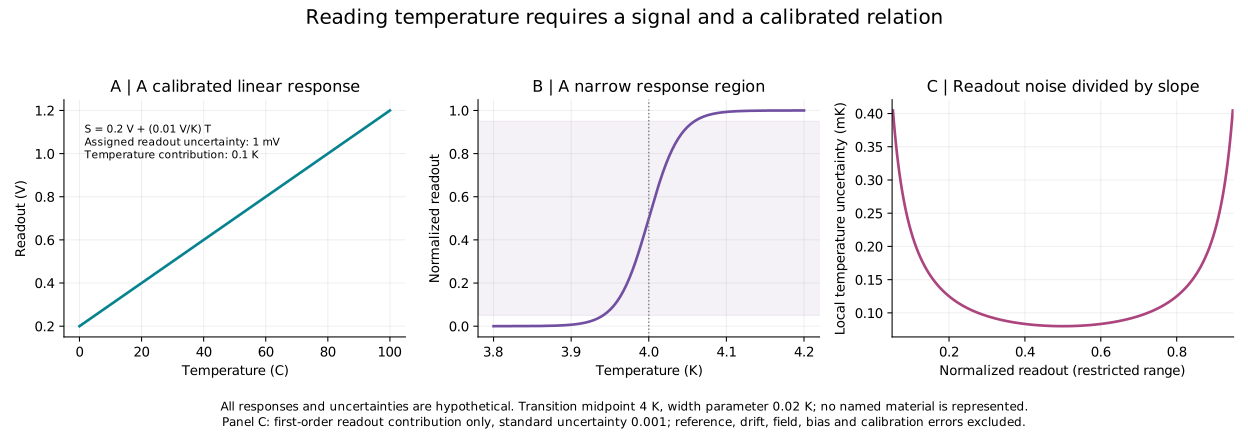
Our invented linear readout is S=0.2+0.01T volts, with T in Celsius over 0–100 °C. Calibration means comparing readings with a reference across a stated range; here the coefficients are assigned exactly for teaching.
At 20 °C, ideal signal is 0.400 V. Add 0.005 V and the unchanged calibration reports 20.5 °C. Repeating a biased measurement does not, by itself, remove its offset.
T=(S−0.2)/0.01. An assigned readout standard uncertainty of 0.001 V contributes 0.1 K when both calibration coefficients are exact. This excludes reference uncertainty, coefficient uncertainty/covariance, drift, thermal contact and other effects.
The fixed offset slider is a deterministic error, not a random draw or a confidence interval. The readout standard uncertainty is a separate assumption. Celsius and kelvin differences have equal numerical size; absolute temperatures differ by 273.15. Readings outside 0.2–1.2 V are outside this calibration.
02 / SHARP RESPONSE, NARROW USEFUL RANGE
An ideal threshold-only device tells you which side of its boundary you occupy, not a unique temperature everywhere. A continuous transition can retain local information after calibration. Real transition-edge devices use a resistive region with suitable readout and often feedback.
Assigned midpoint 4 K and width parameter 0.02 K. These are invented values, not properties of a named substance or a microscopic superconductivity model.
At the midpoint, slope is 12.5 per kelvin. With assigned normalized signal standard uncertainty 0.001, the first-order temperature contribution is 0.00008 K (0.08 mK). That number comes entirely from hypothetical inputs; it is not achieved accuracy.
s=1/[1+exp(−(T−4)/0.02)]. Inverse: T=4+0.02 ln[s/(1−s)], only for 0<s<1. Exact zero or one has no finite inverse here; neither is clipped to create a usable-looking temperature.
Slope=s(1−s)/0.02. Local readout contribution=0.001/slope, shown only for 0.05≤s≤0.95. Near saturation, small signal errors can imply large temperature errors; first-order propagation can fail. No uncertainty value is offered outside the prescribed range. The mathematical curve never reaches exact zero or one.
Sample preparation, magnetic field, bias, thermal coupling and feedback can shift a real transition response. A published curve for one specimen is not automatically the calibration of another instrument. No material-specific critical-field curve is inferred here.
A material name alone does not define a thermometer. Specify the observable, reader, calibration range, comparison reference and uncertainty budget. No optical or electrical mechanism is invented for a proposal that has not specified one.
How closely repeated readings agree under stated conditions. Repeated bias can still look consistent.
How much signal changes per temperature change. High slope alone does not establish low total uncertainty.
Small display steps do not guarantee a close estimate. Trace every meaningful uncertainty contribution.
ORIGINAL HYPOTHETICAL STUDY
Open full-size figure · Calibration CSV · Transition CSV · Methods · Reproduce figure · Parameters and checks
Independent inverse, monotonicity and finite-difference derivative checks verify numerical consistency. The comparison of exact inverse spans with the local approximation applies only to the assigned restricted range; it is not an experimental confidence interval.
Separate process temperature changes from readout drift. Choose a detector's usable range. Record conditions that keep calibration applicable. Ask whether a quoted uncertainty includes the reference, electronics, contact and environment.
These references establish measurement context; none supplies the hypothetical model's performance. No new thermometer or calibrated accuracy is demonstrated.
Back to the field guide →