Imagine this
A tiny hole in a raincoat can let water through. A surface can also push away dust, but a picture alone cannot show if it works well outside the model.
THE FIELD GUIDE / 013 · SURFACES
Think of a raincoat, a dusty window, or a wet road. Each surface needs a different test.
A tiny gap can let much more water through a coating. An electric field can push a charged dust grain, but that alone does not prove a surface gets clean. Start with these everyday examples, then explore what the calculations can and cannot tell us.
See why a small gap matters ↓A tiny hole in a raincoat can let water through. A surface can also push away dust, but a picture alone cannot show if it works well outside the model.
Today, surface measurements help compare coating leaks, dust-removal ideas and worn textures. A chosen surface might help in a particular setting after testing.
The page calculates prescribed flow and an ideal charged-grain force. Real charging, contact, wear and cleaning performance need measurement.
Read-aloud starter; not yet tested with children. The fuller science, data, figures and sources follow below.
01 / CONTINUITY MATTERS
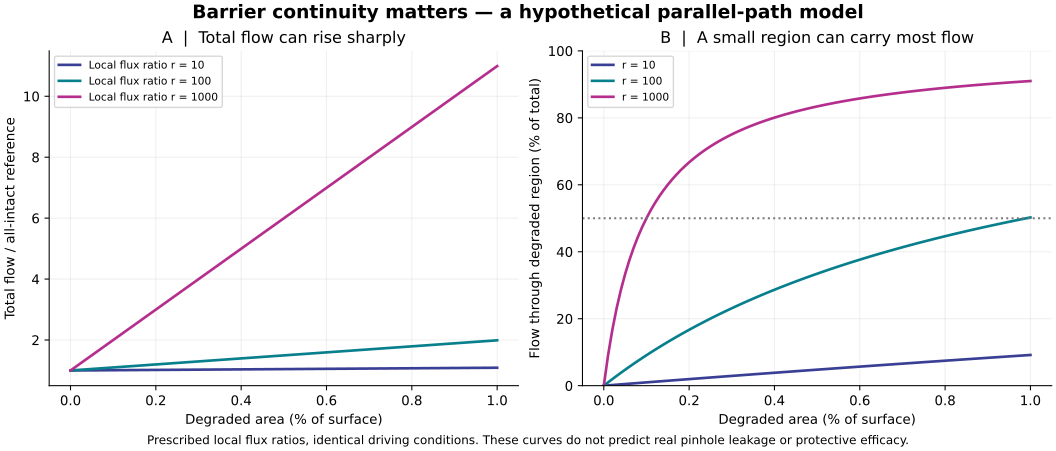
Imagine a coated tile. Most of its area transmits little water vapour; a degraded patch transmits more per unit area. Under the same fixed conditions, add the two contributions. This model prescribes each local flow—it does not predict real-hole leakage from its appearance.
Share of flow: pink = degraded; blue = intact. This bar shows flow, not area.
At 0.1% area and an assumed ratio of 1,000, total flow is 1.999 times the reference. The small patch carries 50.025% of it.
For degraded area fraction f and relative local flux r: total = (1−f)+rf; degraded share = rf/total. Equal contributions occur at f=1/(r+1).
Independent steady parallel patches, identical fixed driving conditions and positive intact flux are assumed. Lateral transport, spreading resistance, boundary layers, geometry, sorption and depletion are absent. Real defect leakage needs more information. No microbial barrier, skin protection or service lifetime follows.
See the intact-film moisture budget for a separate time-accounting lesson.
02 / CHARGE CHANGES THE DIRECTION
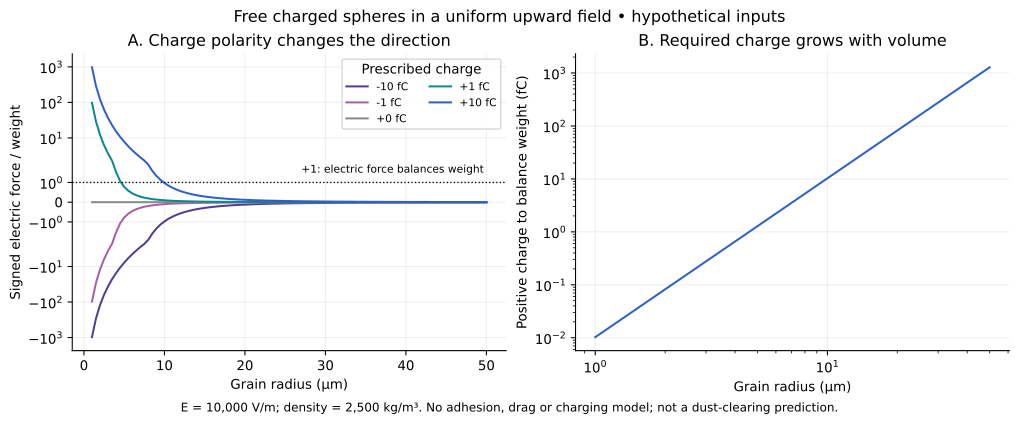
A charged grain feels electric force F=qE. Reversing charge reverses that force. Voltage is a potential difference; the field also depends on distance and geometry.
Upward uniform field 10,000 V/m; density 2,500 kg/m³; g=9.80665 m/s². Charge is independently chosen, not a measured charging law. One femtocoulomb (fC) is 10⁻¹⁵ C.
At 10 µm and +1 fC, the electric force is upward but weaker than weight: initial net acceleration remains downward, about −8.852 m/s². A ratio of +1 balances only these two forces; it does not establish stable levitation.
Mass = 4πρr³/3; weight = mg; electric force = qE; net upward acceleration = qE/m−g. Doubling radius multiplies mass by eight at fixed density.
The grain is free, with no substrate contact. Adhesion, drag, buoyancy, polarization, image forces, collisions, charge exchange and field gradients are omitted. A neutral grain has zero qE here; polarization can matter in nonuniform fields and requires another model.
NASA's electrodynamic dust shields use embedded electrodes and phased signals to produce a travelling nonuniform field. Grain properties, contact and operating environment matter. These documented independent devices are not described by our free-grain calculation. Their demonstrations do not establish performance for an unspecified coating.
03 / AFTER WATER AND WEAR
Fine texture helps tyre contact. Larger texture provides water pathways and affects noise. Polishing can alter the fine texture; blocked drainage or cracks cause different problems.
Identify material, texture, substrate and bonding. Appearance alone gives no friction coefficient.
Measure friction under specified water, contact and speed conditions. Assess drainage separately.
Repeat after polishing, abrasion and thermal cycling. Inspect cracks, joints and repairability.
A material that melts or hardens has not passed a road test. No candidate dataset supports a numerical grip curve here. A conventional glass-containing mixture would be a separately defined material, not proof of an unspecified monolithic road surface.
04 / THE WHOLE LIFE OF A FILM
On an inert tile: apply a specified film → expose it to service → remove it by a specified method → inspect the substrate. These are proposed measurements, not completed tests.
Measure continuity, adhesion, wear, moisture transmission and wet/dry friction separately. Charge dissipation requires an electrical path and its own geometry-dependent measurement.
Record the required method and effort. Strong adhesion and easy removal can conflict; neither is universally preferable.
Inspect residue and substrate damage. Clean-looking is not disinfected. No food-contact or skin suitability is established.
Different formulations can demonstrate different functions. Combining their descriptions does not establish one multifunctional material. No recipe, universal score or measured project lifetime is supplied.
ORIGINAL CALCULATIONS / REPRODUCIBLE STUDIES
CSV data · Methods · Reproduction script · PDF figure
Find whether defects or intact material dominate equipment protection. Investigate dust control for optical and thermal surfaces under actual contact conditions. Select temporary coatings across their service-and-removal cycle. Assess road materials after water and wear. These are practical research questions, not claims of newly demonstrated products.