Imagine this
Pull a strip and see how hard you have to pull and how much longer it gets. A wide strip and a thin strip can act differently even if they are made of the same stuff. Careful tests help compare them.
THE FIELD GUIDE / 014 · MATERIAL MEASUREMENT
Pull a thin strip and a thick strip made from the same stuff. The thick one can feel harder to stretch, even when the material itself is no different.
Think of pulling a stretchy toy. How much it lengthens depends on the pull, its size and the material. We’ll separate those ideas with a simple picture and a made-up test curve. No real sample was tested.
Start with the strip ↓Pull a strip and see how hard you have to pull and how much longer it gets. A wide strip and a thin strip can act differently even if they are made of the same stuff. Careful tests help compare them.
Today, stress-and-strain tests help engineers compare material samples and report what a test measured.
A sample curve does not certify a finished part. Dimensions, joining and production repeatability need separate evidence.
Read-aloud starter; not yet tested with children. The fuller science, data, figures and sources follow below.
How hard are we pulling? Force is measured in newtons (N).
Force divided by the original cross-sectional area. One N/mm² equals one megapascal (MPa).
Extension divided by original gauge length. A 0.25 mm extension over 25 mm is 1% strain.
The slope of an initial elastic stress–strain response. Specimen stiffness also depends on its dimensions.
01 / SAME MATERIAL, DIFFERENT PIECE
A uniform straight bar in uniaxial elastic tension has extension FL₀/(EA₀). Here E is a hypothetical 1,200 MPa and thickness is 0.50 mm. This separate elementary model is limited to a chosen 1% strain range.
At 30 N, width 5 mm and length 25 mm: stress is 12 MPa, strain 1%, and extension 0.25 mm. Double the width and extension halves. Double the length and extension doubles, while strain stays unchanged.
A₀=wt; σ=F/A₀; ε=σ/E; ΔL=εL₀; stiffness=EA₀/L₀. The 1% range is an editorial bound for this teaching model, not a material allowable. No failure, fatigue, buckling, stress concentration, rate or temperature dependence is modelled.
Bending also depends on section shape and support/loading arrangement. A tensile curve alone does not measure flexural stiffness or bending strength.
Pulling a strip and exposing it to a liquid test different properties. A strong strip can still swell, dissolve or lose strength in a particular chemical environment. A resistance claim needs the liquid, exposure conditions, specimen identity and a defined outcome, such as a change in mass, dimensions or strength. None of those chemical-resistance measurements is supplied here. A substance suspended inside a container does not identify the material of the container wall.
02 / THE SAME FORCE CAN BECOME A DIFFERENT REPORTED STRESS
Our synthetic strip has original width 5 mm and thickness 0.50 mm. Its assigned engineering curve rises with slope 1,200 MPa to 2.5% strain, then with slope 40 MPa to the chosen 10% endpoint. This is a prescribed curve, not a discovered material law.
Actual model geometry and force stay fixed as the assumed measured thickness changes. Width is assumed known exactly in this interaction. No load noise is added here.
The final sampled point is 33 MPa and 82.5 N. This is only the endpoint of our increasing curve. It is not ultimate tensile strength or breaking strength. The slope change is assigned, not a measured yield point.
Engineering stress uses original area. True stress uses instantaneous area during deformation. This model contains no instantaneous-area measurement, necking, fracture or unloading law. It cannot determine permanent strain or toughness to fracture.
PUBLISHED NIST STUDY / MEASURED TEST RESULTS
Imagine five kitchens following the same recipe. The cakes may still differ more from kitchen to kitchen than from one batch to the next inside a kitchen. NIST asked a similar question about the strength of additively manufactured cobalt–chromium metal.
Yield strength is a standard marker for when a metal begins to keep a small permanent change after being pulled. Each dot below is one reported test result from one of the five laboratories in NIST’s same-process comparison. The numbers come from a published NIST dataset; this is a separate real-study case, not the made-up curve later on this page.


The key comparison: NIST estimated that between-laboratory variability in yield strength was 4.9 times the median within-laboratory variability. That means results differed more from one participating lab to another than repeated results typically differed inside a lab. It does not mean the metal was 4.9 times stronger, or that every printed part will behave this way.
| Measured property | Ratio | How to read it |
|---|---|---|
| Tensile strength | 2.7× | Between-lab estimate was larger |
| 0.2% offset yield strength | 4.9× | Between-lab estimate was larger |
| Elongation | 3.5× | Between-lab estimate was larger |
| Elastic modulus | 0.5× | Between-lab estimate was smaller |
The report compared five laboratories using nominally similar laser powder-bed-fusion systems and powder from the same batch. It also found slightly different microstructures across laboratories and showed that post-build heat-treatment conditions can matter. This points to a practical challenge: before a printed part can be trusted in a demanding job, teams need repeatable production and testing—not just one strong specimen.
The parent study involved eight laboratories overall: six used laser powder-bed fusion and two used electron-beam powder-bed fusion. The ratio above is specifically the five-laboratory model comparison in Table 5; it is not an average of all eight participants or a universal property of additive manufacturing. The plotted dots show NIST’s reported test-level yield-strength values for those same five labs.
This is evidence about one cobalt–chromium alloy study and its manufacturing/test conditions. It does not prove that one machine, laboratory or process is generally better, and it does not qualify a component for any particular use. The experiment helps show why repeatability, process records and multi-laboratory testing matter.
NIST test-result data (CSV)Column definitions (CSV)Stress–strain source data (CSV)Stress–strain column definitions (CSV)Table 5 values used for the ratio summary (CSV)NIST dataset READMEFigure reproduction scriptSources, extraction and limitsMachine-readable values and checks
NIST data credit: William Luecke (2018), Data from NIST TN 2006. The NIST dataset record identifies its public license and the source report. DMGB Systems adapted the data into original vector plots; NIST does not endorse this site.
ORIGINAL SYNTHETIC STUDY / METHODS AND DATA
This next study is a separate teaching model. It is synthetic: all curve and error parameters were assigned for demonstration, and no physical specimen was tested.
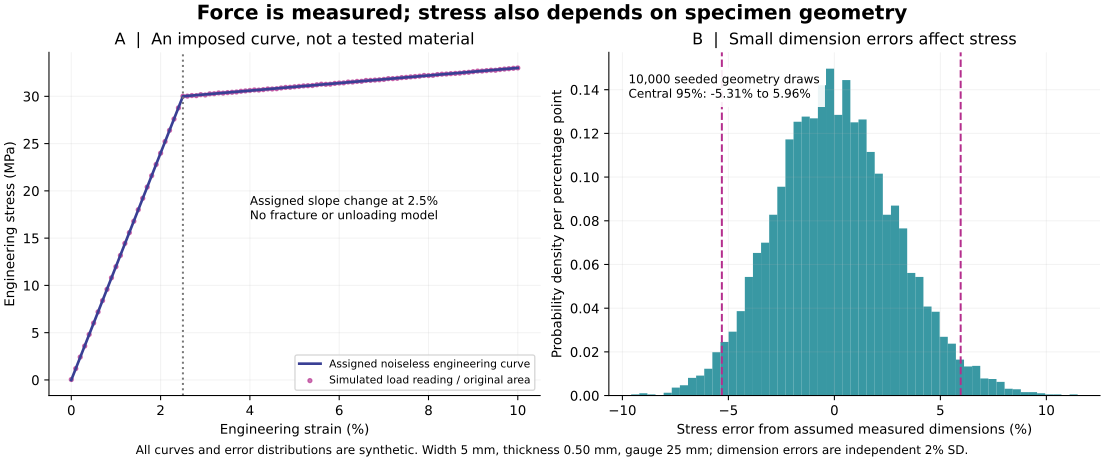
The study adds Gaussian load noise with standard deviation 0.05 N to 101 readings. Separately, it assigns independent 2% standard deviations to width and thickness measurement errors. Geometry alone produces a central 95% simulated stress-error range of −5.308% to +5.957%. Correlated errors, calibration bias or another uncertainty model would change it.
Curve CSV · All 10,000 draws · Methods · Reproduction script · Parameters and checks · PDF figure
Dimensional conversion, force/area identities, continuity of the assigned curve and inverse-area error are checked independently. These checks establish numerical consistency, not validation of a physical material.
Identify the specimen and its original dimensions, conditioning, loading direction, temperature and strain rate. Explain load calibration and how gauge extension was measured. Report uncertainty and repeatability under those conditions.
Separate a thick specimen from a high-modulus material. Geometry can change how stiff a component feels.
Modulus, yield, strength, fracture strain and toughness are distinct outputs. A graph that stops is not evidence that a specimen broke.
Dimensions can shift a reported stress even with an accurate force reading. Inspect calibration, bias and correlations before claiming an improvement.
No standard compliance, improved material, product readiness or design allowable is claimed. The proposed physical measurements are not prerequisites for understanding this educational model.
Back to the field guide →MATERIALS / A JOIN IS NOT ONE PROPERTY
The very simple version: Imagine a wall made from tiny tiles. Two walls can look the same from far away, while the tiles meet differently inside. Joining metal can change its internal arrangement near the join. Looking smooth does not tell us how it will stretch or crack. Metal is not literally a tile wall: this is an analogy, not a prediction.
For a bicycle frame, a heat exchanger or a precision instrument, a useful joint must meet the needs of that particular job. Better evidence could support durable repairs, reduce wasted parts and help engineers choose suitable processes. These are potential benefits of well-characterized joining, not demonstrated benefits of the unverified proposal in our register.
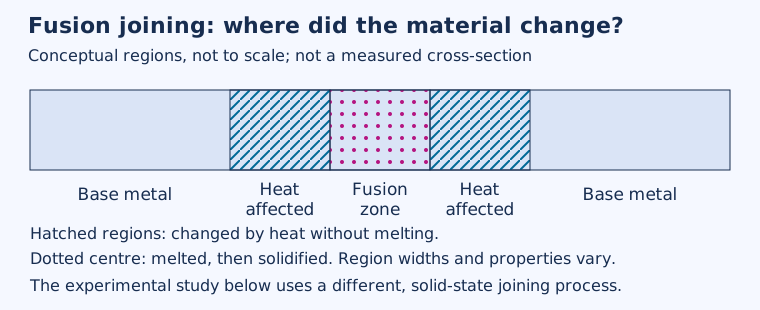
Fusion welding melts part of the material; the surrounding heat-affected region can change without melting. Solid-state joining, including friction-stir welding, does not require melting the joint. The schematic below is specifically about fusion welding. It is not the geometry of the published friction-stir specimens discussed next.
On small screens, scroll the schematic sideways to read all regions.
A suitable shielding gas can help protect hot metal from reactions with air. That alone does not show that its original structure or mechanical properties survive. The unspecified shielding arrangement in the idea register has no supporting material measurements.
Malopheyev and colleagues reported the following results for their 6061 aluminium specimens. The starting material was extruded and T6 tempered; the double-sided friction-stir joints received artificial ageing after welding. These are published measurements from that specific comparison, not our experiments and not a universal rating for welding.
| Specimen condition | Yield strength (MPa) | Ultimate tensile strength (MPa) | Elongation to failure (%) |
|---|---|---|---|
| Base material | 316 ± 3 | 362 ± 1 | 9 ± 1 |
| Friction-stir joint, aged after welding | 283 ± 7 | 311 ± 12 | 3 ± 1 |
The source reports at least two tensile specimens per material condition, tested transversely at ambient temperature. The exact count and meaning of the ± statistic are not specified in the inspected account. We reproduce those values without calling them standard deviations, confidence intervals or uncertainty bounds. The reported joint fracture location was the heat-affected zone.

This reader performs arithmetic on published central values. It is not a simulator of welding, a test of statistical equivalence or a prediction of a new joint. The tensile endpoints do not establish unchanged elastic modulus, fatigue life, corrosion resistance or microstructure.
| Question | Relevant evidence | What cannot substitute for it |
|---|---|---|
| Same elastic stiffness? | Comparable elastic stress–strain measurements with specimen geometry and uncertainty. | Maximum load or a smooth seam. |
| Same elastic recovery? | Defined load–unload response and residual deformation. | Yield strength alone. |
| Same internal structure? | Located, scaled microscopy and relevant phase/composition evidence. | An illustrative drawing or shielding gas. |
| Same durability in repeated loading? | Fatigue evidence under specified loading and environment. | One monotonic tensile test. |
| Suitable for its environment? | Relevant corrosion, leakage or dimensional-stability evidence for the application. | Mechanical strength alone. |
“Elasticity” can refer to stiffness, recovery or the limit before permanent deformation. These are different quantities. There is no single percentage that proves all properties were preserved. Cutting and joining also have different outcomes; this joining lesson does not establish the separate cutting claim.
Scientific figure · PDF · Published values · CSV · Reproduce the chart · Python · Methods and provenance · JSON
Attribution and scope: adapted from Malopheyev, Vysotskiy, Zhemchuzhnikova, Mironov and Kaibyshev, On the Fatigue Performance of Friction-Stir Welded Aluminum Alloys, Materials 13 (2020),4246, Table 4 and §§2.1,2.2,2.5. Open full text, licensed CC BY 4.0. DMGB Systems redrew the table as plots and calculated central-value ratios. No additional experimental observations are implied. This excerpt does not reproduce or assess the paper's separate fatigue study.
Conceptual references: TWI: heat-affected zone, solid-state welding and fusion welding and shielding.
Open the unresolved joining proposal. Its energy source, alloys and before-and-after measurements remain missing. The conventional study above does not validate that proposed process.