Imagine this
Your two eyes see an object from slightly different places. A computer can compare two camera pictures to estimate distance. If the pictures do not match well, the answer can be very uncertain.
THE FIELD GUIDE / 022 · STEREO VISION
A small shift between images can reveal distance. It can also magnify a small error. Seeing the geometry helps explain both.
Your two eyes see an object from slightly different places. A computer can compare two camera pictures to estimate distance. If the pictures do not match well, the answer can be very uncertain.
Today, stereo geometry explains how paired cameras can estimate depth and why spacing and matching matter. A real inspection or robot use needs tests with real targets.
The simple model works when its assumptions fit. Camera setup, poor light, movement, blocked parts and mismatched pictures can all cause mistakes.
Read-aloud starter; not yet tested with children. The fuller science, data, figures and sources follow below.
Look at a nearby object with one eye, then the other. Its position relative to the background shifts. Two cameras can use a related geometric clue: find the same feature in both images, measure its displacement and combine that with the known camera arrangement.
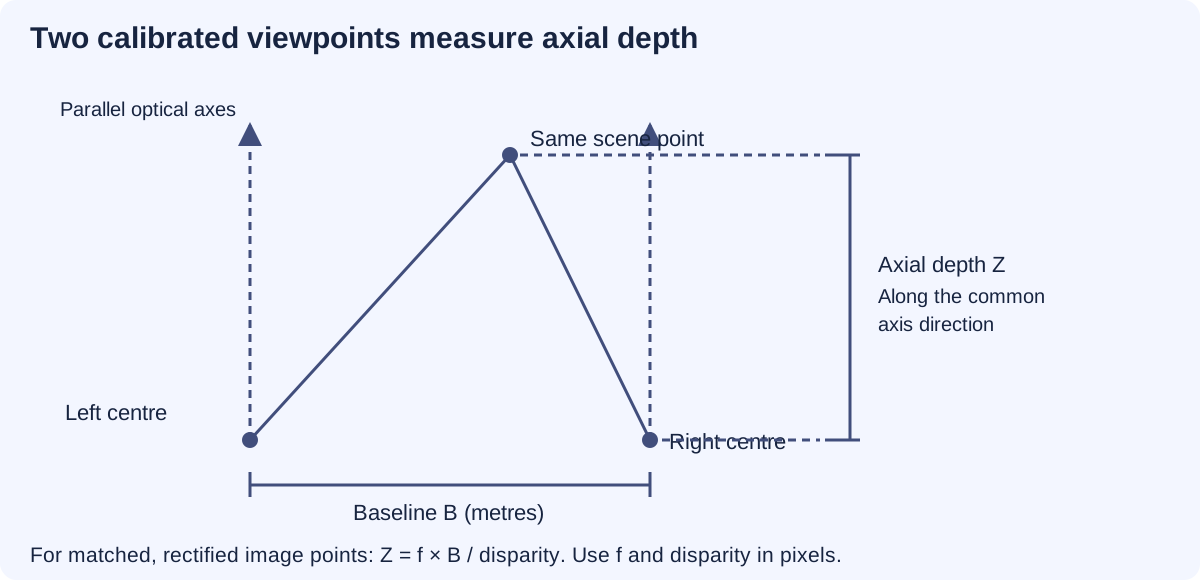
The image displacement is called disparity. In a simplified calibrated camera pair, nearby features have larger disparity and distant features smaller disparity. When the shift becomes tiny, even a small matching error can create a large depth error. OpenCV stereo geometry
TRY THE GEOMETRY
Choose the true depth of a synthetic point and the camera separation. Two parallel, rectified pinhole cameras have a focal length of 800 pixels and matched principal points. We assume the same feature has been found correctly in both images.
The recovered depth returns the assigned input because this ideal model contains no matching error. The uncertainty calculation separately assigns a disparity standard deviation of 0.5 pixels.
This interval assumes the disparity lies within the selected ± discrepancy. It is not a 95% confidence interval and is not derived from the standard deviation above. If the allowed discrepancy reaches zero disparity, no finite upper depth bound remains. A zero camera separation cannot triangulate depth.
A wider separation improves this ideal sensitivity, but can reduce overlap or hide a feature from one camera. Repeated patterns, reflections, motion and calibration errors are excluded here.
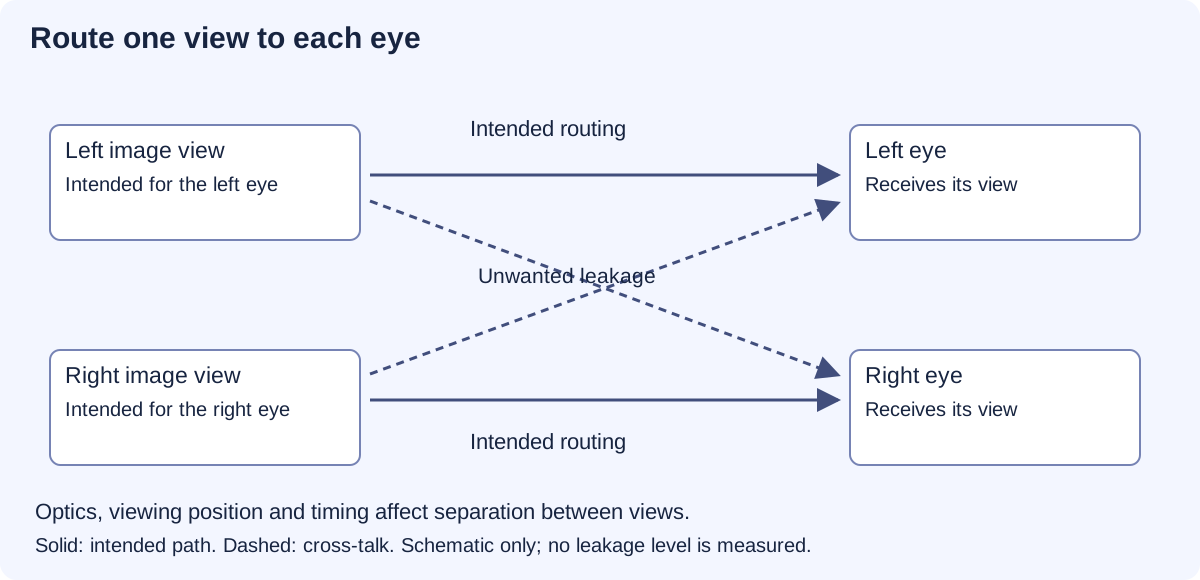
A reconstruction estimates scene geometry. A stereo display sends a different view to each eye so the visual system receives a depth cue. A convincing display can show a completely invented scene; its appearance does not prove that any depth was measured.
Some displays separate views with glasses. Others use a patterned barrier or small lenses to direct different image regions towards different viewing positions. These glasses-free arrangements have viewing zones: move outside the intended position and the views can mix or swap. More views can also divide the available pixels or light. Primary parallax-barrier display study
An immersive room or headset should update perspective as the viewer moves. Field of view describes the angular area covered; it does not tell us how much fine detail is visible. Tracking, rendering and transmission add delays. Different viewers also occupy different positions, so an image correct for one viewpoint may be wrong for another. The CAVE primary paper
Head tracking estimates where the head is. Gaze tracking estimates where the eyes are directed. Either can help control a display, but neither automatically gives a reliable image to each eye. Leakage between views, tracking errors and delay still need measurement.
In a conventional stereo display, the eyes may turn towards a depicted depth while focusing on the physical screen. These two demands can conflict. That is one reason why visual comfort cannot be inferred from resolution or field of view alone. The geometry demonstration here does not measure comfort or prescribe viewing settings. Primary study of focus and disparity cues
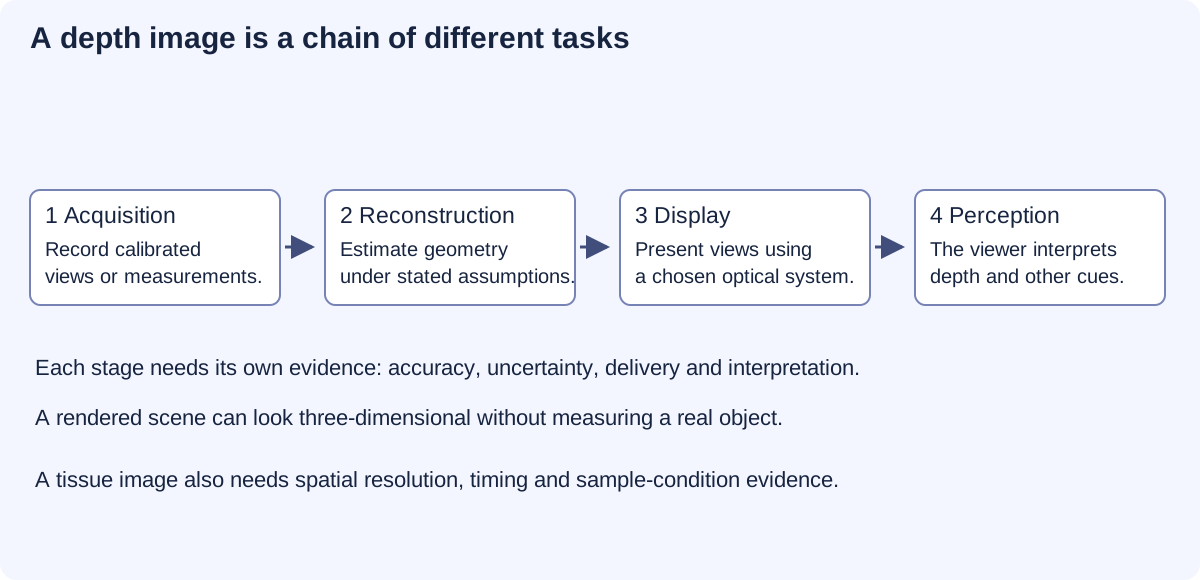
Can the instrument resolve the structure? Can it distinguish positions in depth? Can it record change quickly enough? Does the specimen remain in an appropriate condition during observation? Each needs its own evidence. Lateral resolution, axial resolution and depth of field are different properties; a sharply displayed volume does not prove that all its planes were independently resolved. A volume assembled over time can also distort motion. Illumination dose, preparation and environmental conditions matter for specimen viability.
A stereo view can help interpret shape, but it does not by itself reveal molecules. Having several planes look sharp is not the same as measuring fine axial resolution. Faster or more detailed imaging may require different illumination, detectors or acquisition methods, with consequences for noise and sample exposure. A 3D rendering must be labelled as a rendering, reconstruction or measured volume as appropriate.
Stereo geometry already helps estimate terrain and object shape. Immersive displays help people explore scientific data and inspect designs. Well-calibrated imaging can also help present specimen structure. Future improvements could make these tools more reliable by reducing matching ambiguity, display leakage and delay. Each improvement needs its own measurements; a single attractive depth effect cannot validate the entire system.
The interactive camera pair is a synthetic geometry model. It demonstrates sensitivity to a chosen disparity uncertainty, not the measured accuracy of a camera, a medical imaging device or a display-comfort study.
REPRODUCIBLE STUDY
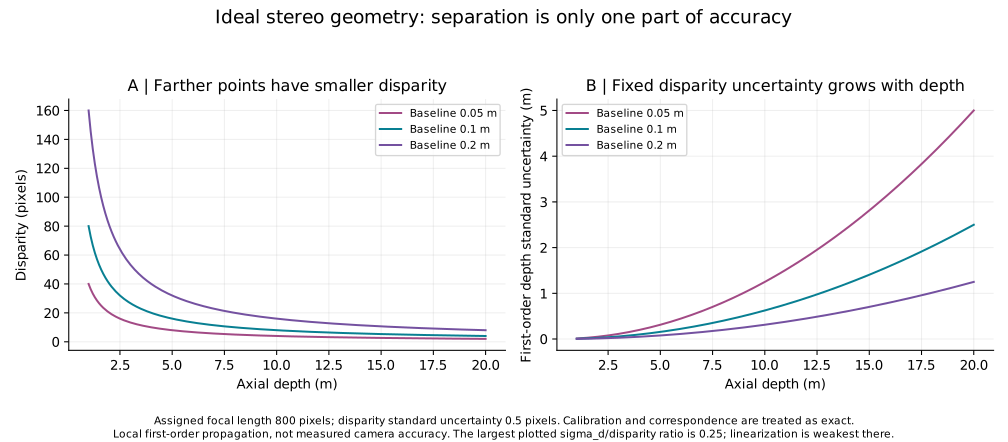
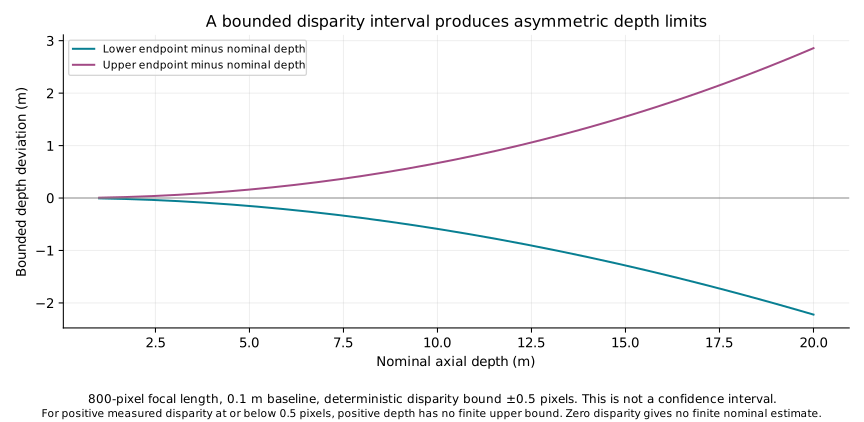
The study supplies 573 geometry cases and eight boundary cases. Numerical checks cover inverse geometry, interval endpoints and finite-difference sensitivity. They do not test feature matching on real images.
For the stated camera geometry, disparity d = fB/Z and axial depth Z = fB/d, where f is focal length in pixels, B camera separation in metres and d disparity in pixels. Axial depth is measured along the reference optical axis; it is not general slant range from a camera to the point.
With exact f and B and small disparity standard deviation σd, the first-order standard uncertainty is σZ ≈ fBσd/d². Calibration uncertainty, correlations and wrong feature matches are excluded. A vanishing assigned σd would only remove this one error contribution.
Separately, a bounded discrepancy Δ gives [fB/(d+Δ), fB/(d−Δ)] when d > Δ. If 0 < d ≤ Δ, the upper bound is unbounded. At zero baseline or zero disparity the finite triangulated estimate is unavailable. At f=800 px, B=0.10 m and Z=2 m, d=40 px; σd=0.5 px gives σZ=0.025 m. A separate bound ±0.5 px gives 1.975309–2.025316 m.
These curves are analytic sensitivity calculations, not measurements of a camera, display comfort or living tissue. Agreement with them verifies arithmetic under the assumptions; it does not establish real-world accuracy.
Chen and colleagues: lattice light-sheet microscopy describes a defined method for observing living specimens. It is distinct from a simple stereo camera pair and requires its own acquisition and specimen conditions. No numerical performance from that instrument is assigned to this chapter.
A proposal to form an image within a volume of air or another medium asks a different question from sending separate views from a screen to each eye. It must explain where the visible light comes from, how locations in the volume are selected and which viewing positions work. A drawing of a floating image supplies none of those measurements; the stereo geometry demonstration here does not model such a device.