Imagine this
Imagine a class choosing a game. If some children are away, we do not know what they would have chosen. A counting rule can count the answers we got, but it cannot speak for the people who were missing.
THE FIELD GUIDE / 047 · COLLECTIVE CHOICE AND NETWORKS
A community workshop needs to choose an activity. Counting preferences, telling everyone the result and checking whether the activity worked are three different jobs. A single score cannot do all three.
Follow a fictional notice ↓Imagine a class choosing a game. If some children are away, we do not know what they would have chosen. A counting rule can count the answers we got, but it cannot speak for the people who were missing.
A workshop can publish its counting rule, show nonresponse and check whether people can attend. A planning tool could compare schedules after testing with the intended community.
The network study is synthetic; it does not establish representativeness, fairness or policy effectiveness in a real group.
Read-aloud starter; not yet tested with children. The fuller science, data, figures and sources follow below.
Suppose 20 people are invited to choose between a repair workshop and a gardening session. Six choose repair, four choose gardening and ten do not answer. Repair has 60% of the ten responses, but support from 30% of those invited. We do not know what the ten nonrespondents prefer.
A rule can select the most requested topic among responses. It cannot establish that the responses represent everyone, that everyone can attend or that the losing preference should be ignored. If the count is five against five, a tie rule must already be clear. A second session, a later ballot or a disclosed lottery would be different choices, not consequences of arithmetic alone.
| Question | Why it changes the interpretation |
|---|---|
| Who can respond? | Eligibility defines whose preferences the count can describe. |
| How many responses are needed? | A quorum is a chosen participation requirement, not proof of representativeness. |
| What happens to ties and missing answers? | Neither should silently become support for a default option. |
| Can people attend, and are alternatives accessible? | Popularity alone does not solve scheduling or access. |
| Can the process be checked? | Counting responses is distinct from privacy, ballot security and a trustworthy record. |
The proposal in this collection does not specify these rules or a scheduling optimizer. The useful present-day application is a transparent workshop survey whose scope and omissions are visible.
SMALL ASSIGNED NETWORK · NO REAL PARTICIPANT DATA
A dot represents a fictional participant. A line represents a possible contact. A newly informed participant gets one chance to pass the notice to each still-uninformed neighbour. Participants already counted as informed do not keep retrying failed transmissions.
Changing either setting starts a new example using fixed seed 1. Reset repeats the same sequence. The limit is eight rounds.
Filled nodes have received the notice; double outlines mark newly active nodes. Participant 0 starts informed. The text lists provide the same information.
Exact demonstration rule · Demonstration methods · Boundary checks
Receiving a notice is not agreeing with it, believing it or acting on it. The contact map and transmission probability are invented. This small demonstration is separate from the 120-node stored study below; its rounds are logical updates, not minutes or days.
The probability applies to each eligible one-time attempt. With k newly active neighbours making independent attempts at the same receiver, the chance of at least one successful attempt is 1 − (1 − p)k. That follows from this assigned independence rule. It is not an estimated law of human communication.
The mechanism follows the single-opportunity idea in the independent cascade model described by Kempe, Kleinberg and Tardos. Citing that definition does not validate our graph or its probabilities.
STORED SYNTHETIC STUDY
Imagine one arrangement where contacts stay local and another where links connect distant parts of the group. Equal contact counts do not make those arrangements identical. Missing links can change reach again.
A connection needs a clear meaning. Two people may be relatives, work under the same manager or exchange messages; those are different relationships. Here a line means only a possible route for one notice. It does not measure affection, authority, agreement or a person's abilities.
A water-pipe or electrical-circuit diagram can help explain what nodes and links are. Its flow laws do not automatically describe people. A network may help investigate how surroundings and relationships affect an outcome, but the drawing alone cannot establish causation or show that individual biology and experience are irrelevant. That would require defined outcomes, observations and comparison of competing explanations.
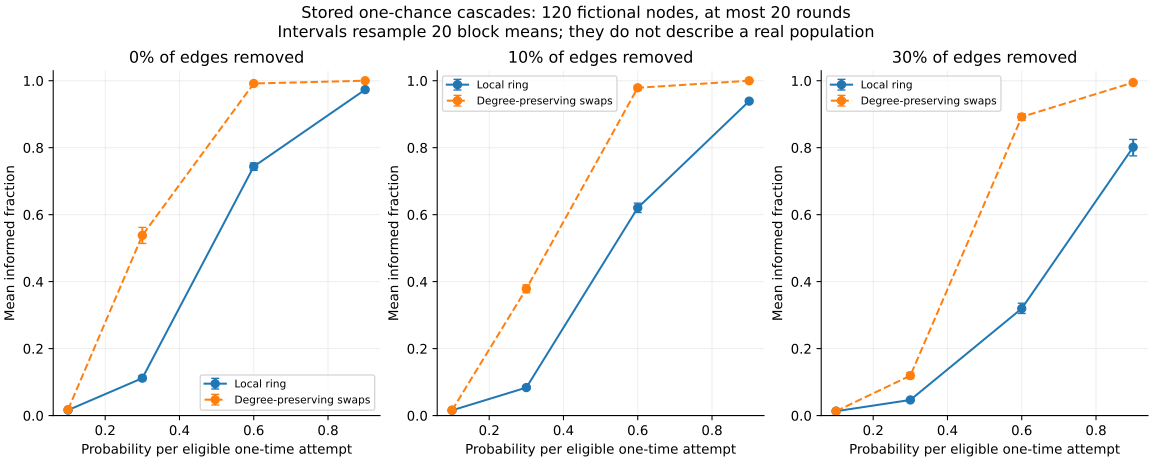
The stored calculation uses 120 nodes, initially six contacts per node and 360 undirected edges. It compares a ring with networks changed by 3,600 accepted degree-preserving edge swaps, then removes 0%, 10% or 30% of edges. Degrees remain equal before deletion, not necessarily afterward. The randomization is neither the standard small-world rewiring procedure nor a proven uniform sampler.
At transmission probability 0.1 with no removed links, mean reach is about 1.64% in the ring and 1.78% in the randomized arrangement, including the initial participant. Neither reaches 90% in those trials. These small values illustrate the chosen rule, not the likely performance of a real announcement.
Four probabilities, three deletion levels and two arrangements produce 24 cells. Each cell contains 20 blocks of 50 cascades: 1,000 cascades per cell and 24,000 overall, stopped after at most 20 rounds. A block's damaged graph is reused across its four probabilities. No-deletion ring blocks share the same topology.
The stored intervals are percentile bounds from 5,000 bootstrap resamples of 20 block means. They describe this particular simulation procedure. The snapshot does not retain individual trajectories or block arrays, so the downloadable plotting script cannot recalculate these intervals independently.
The download also retains the fraction reaching 90% and a conditional time. That time first averages successful runs within each qualifying block, then weights qualifying blocks equally. It is not the average over all successful runs or the time every cascade requires. An empty cell means no qualifying success, not zero time.
Legacy metadata described repeated transmission. Inspection of the executed loop and boundary checks show a one-chance cascade instead. The public export corrects those labels while preserving the stored numbers. This is a documented interpretation correction, not a new run of the experiment.
Five fictional regions have different starting preferences. A synthetic calculation compares one recommendation based on pooled reports with a recommendation for each region. Each recommendation is the majority of observed reports, pooled across all regions or counted separately within each region. It then lets some simulated agents adopt a recommendation they initially disagreed with.
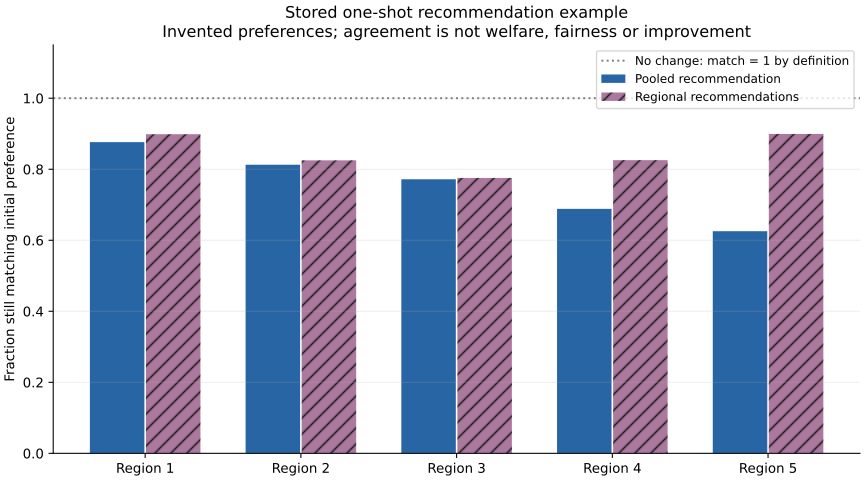
Mean agreement with initial preferences is 75.49% for the pooled rule and 84.48% for regional rules. But doing nothing scores 100% by definition. The metric rewards staying with the initial preference; it does not measure whether an activity is useful, fair, consensual or educational.
Each of five regions contains 2,000 invented agents. Their initial probabilities of preference 1 are 0.2, 0.35, 0.45, 0.65 and 0.8. Observation coverage is 0.8; reports flip with probability 0.05; agents adopt a disagreeing recommendation with probability 0.5. Ties choose option 1. The two policies use separate random adoption draws.
This is a one-shot comparison. There is no delayed response, repeated adjustment, dynamic stability test or measured social feedback benefit. Raw trial arrays were not retained. Zero observations are outside this stored setup: a tie default without observations must not be presented as an informed estimate.
A map connecting attendance, satisfaction and resources can help people ask questions. To predict attendance, it still needs defined variables, measured inputs, relationships, an update rule, a time horizon and a comparison with outcomes not used to build it.
The eleven-node proposal in this collection lacks calibrated states, weights and a suitable dataset. A nearby survey does not supply its missing dynamics. No forecast accuracy follows from drawing arrows between plausible ideas.
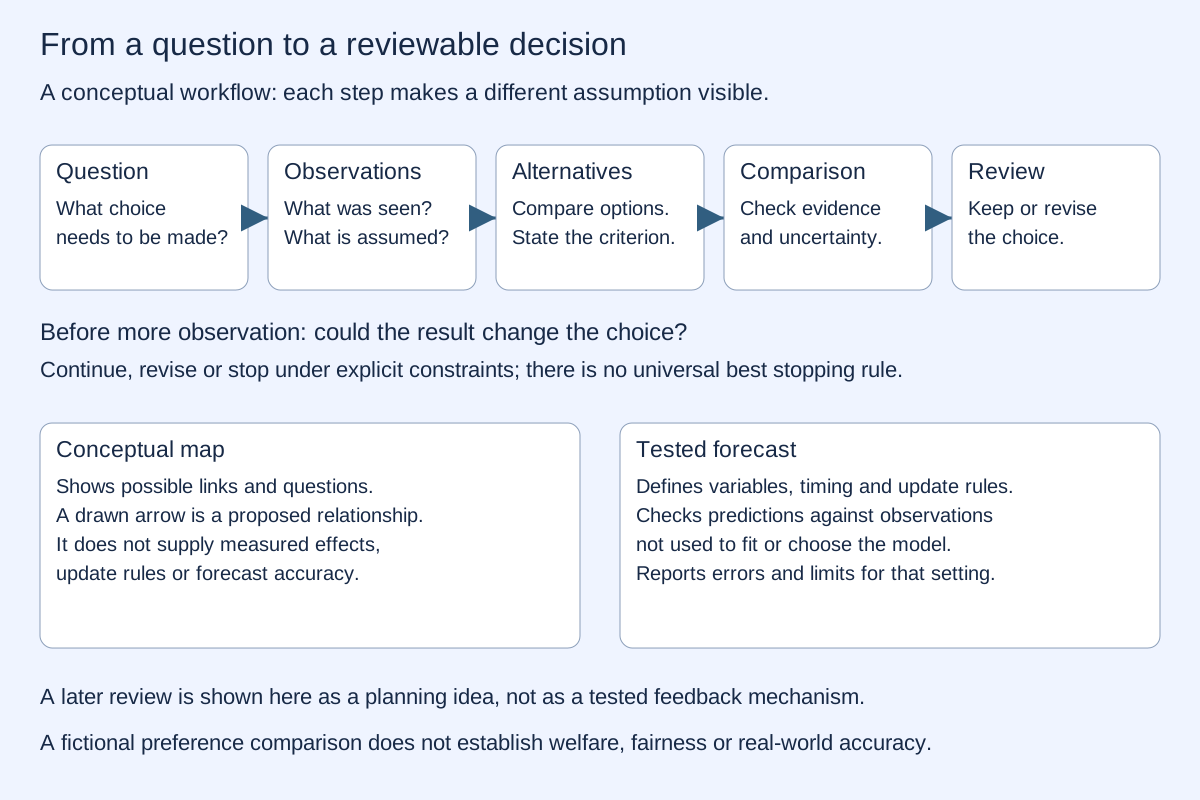
Before the workshop, organizers might first check room capacity, then ask about available times, then compare feasible schedules. If every remaining schedule fits the room equally well, measuring its dimensions more precisely may not help choose among them. Finding out whether participants can attend could matter more.
This example illustrates choosing observations for a stated decision. It supplies no universal stopping rule or proven optimal allocation of survey effort. The staged observation proposal describes steps and fallback choices, not an implemented optimizer or measured advantage over another workflow. NASA's decision-analysis guidance provides a methodological reference for comparing alternatives, criteria and uncertainty.
Today: a small organization can publish its counting rule, show nonresponse and scheduling constraints, and explain how it made a choice. A network diagram can help identify a contact gap without claiming to predict belief.
Possible next step: an inspectable planning tool could compare feasible workshop schedules, make missing information visible and record whether later observations support its forecasts. Its performance would need evaluation on the intended use. A transparent tool does not itself establish representative participation, fair decisions or public authority.
All 24 network cells · Five regional means · Neutral numeric snapshot · Export and plotting script · Methods and limits · Export checks
Run the script with Python, NumPy and Matplotlib. It exports and replots stored results; it does not rerun the original simulations or bootstrap. The export checks cover cell uniqueness, bounds, interval ordering, missing-time semantics and regional consistency. They do not validate claims about real communities.
In a simple chain with only one route, breaking one link separates its ends. If another route remains, the ends may still be connected. Whether a message actually gets through also depends on the rules, capacity and delays. A society cannot be assumed to behave like a single wire: its connections and the outcome being studied must be defined and checked.